Data Access Viewer (DAV)
Introduction
The POWER Data Access Viewer (DAV) Web Mapping Application contains geospatially enabled solar, meteorological, and cloud-related parameters formulated for assessing and designing renewable energy systems. The POWER DAV is a responsive desktop application that runs on all platforms (Apple, Android, and Windows) and modern web browsers (Chrome, Safari, Edge, Firefox, etc.). Through the DAV, POWER provides various text, tabular, and geospatial data sets and files that you can download or integrate into custom software and applications for further processing, analysis, and visualization. It is an enhanced and improved application, similar to the legacy POWER Data Access Viewer, with upgraded plotting and other capabilities.
The POWER DAV leverages the ArcGIS SDK for JavaScript and is built with an Esri Calcite interface. The developers designed this application for any user, regardless of previous experience with downloading NASA data, to access their data and create custom plotting graphs for geospatial data interaction, subsetting, geoprocessing, and analysis.
This guide provides an introduction to the POWER DAV features.
Get Started
Make sure to use the Data Access Viewer (DAV) to take advantage of the latest POWER data and enhancements!
- The POWER Data Access Viewer is a web-based application that currently supports Chrome, Safari, Edge, and Firefox. Please ensure the latest version of your browser is installed to ensure full compatibility.
Tools and Features
The following sections detail the layout and functionality of the POWER DAV, which enables you to locate, analyze, and interact with geographic data and map features.
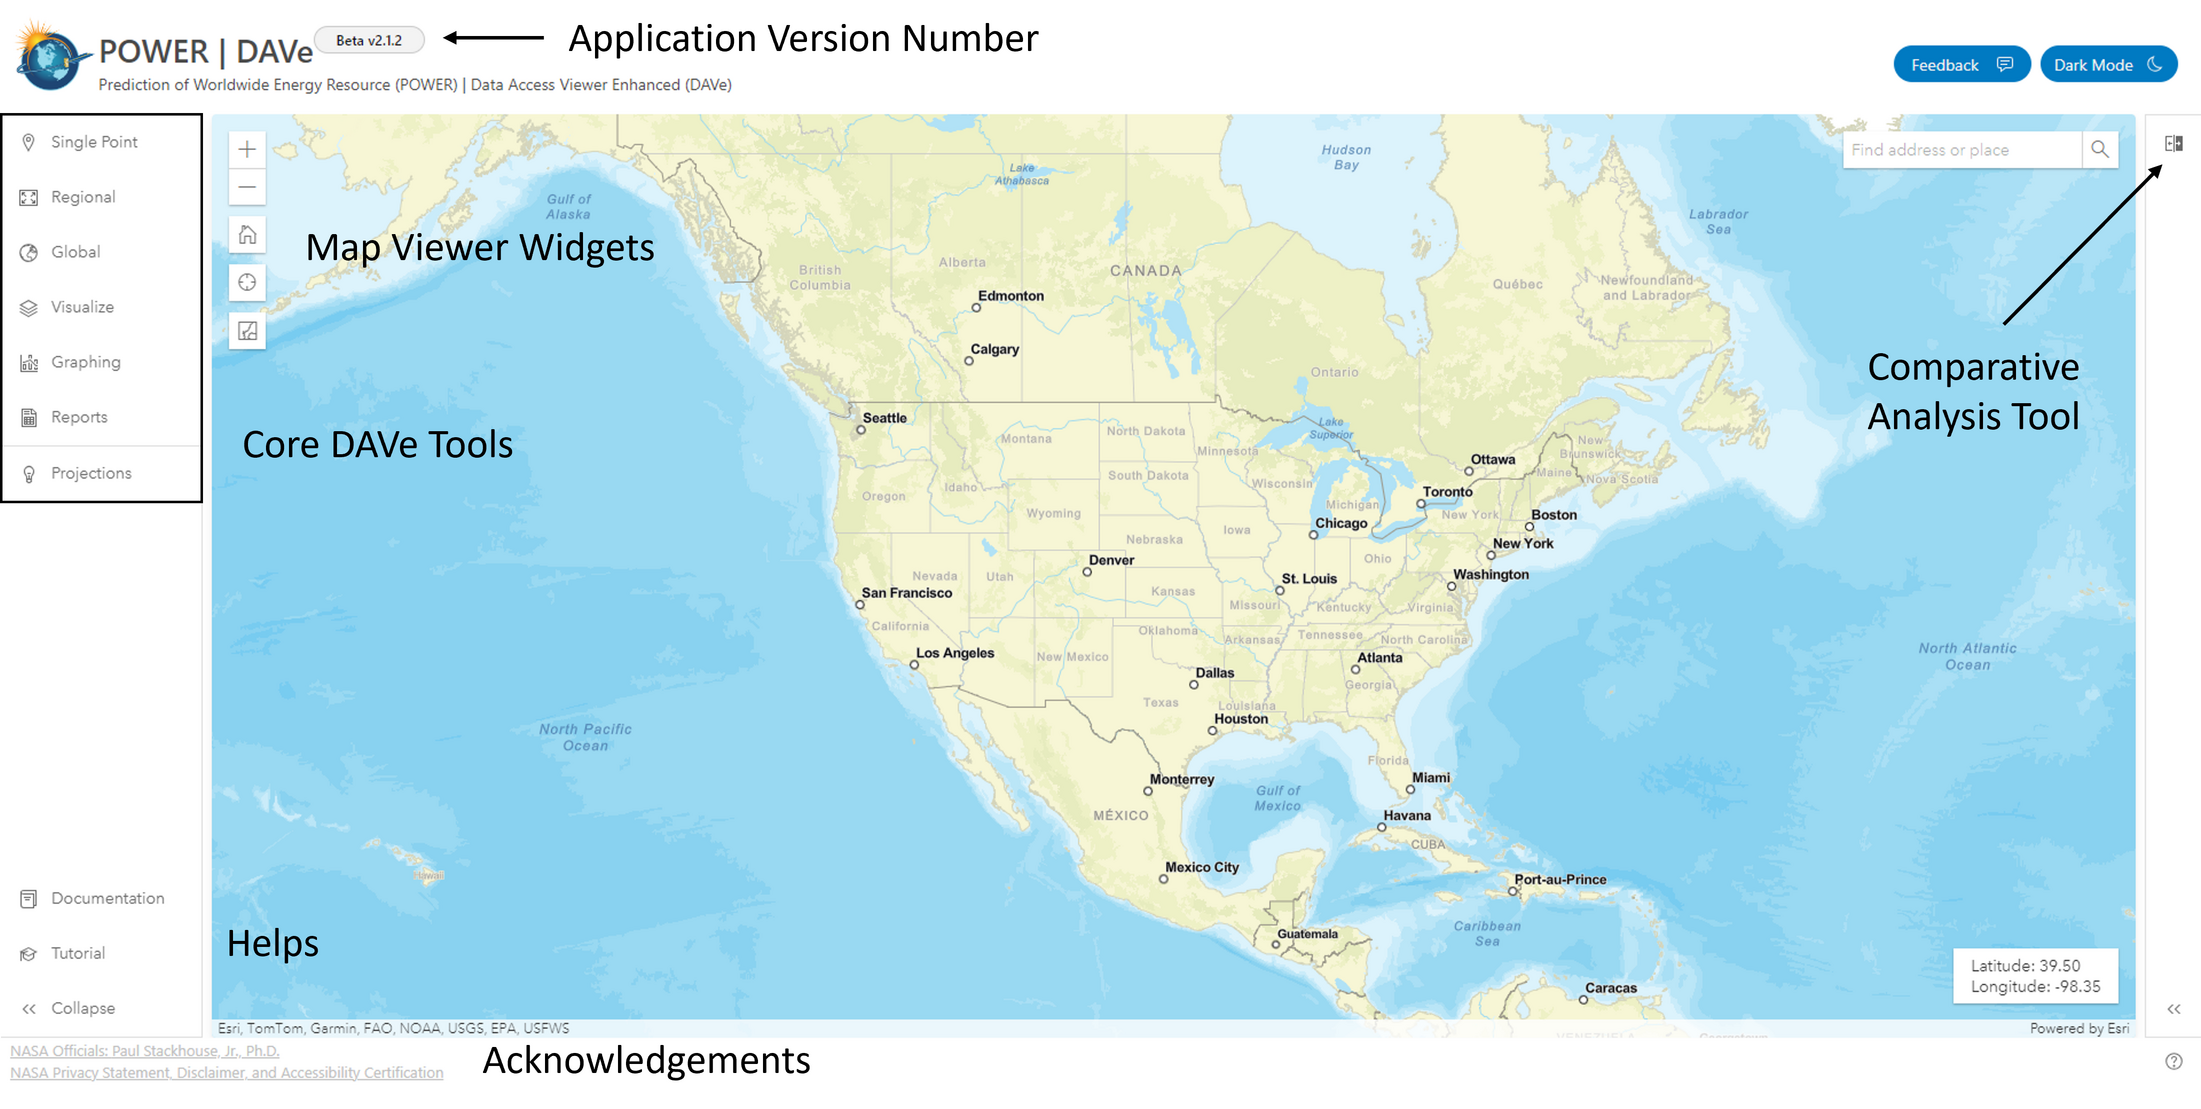
- Core DAV Tools are used to download and interact with POWER data.
- Map Viewer Widgets enable interactive mapping functionality.
- Application Version Number provides a snapshot in time and functionality.
- Location Search Bar allows you to find addresses or places on the map.
- App Settings allows you to personalize the DAV, choosing between light/dark mode and imperial/metric units.
- Comparative Analysis Tool is used to visualize POWER data as layers in the map.
- Parameter Dictionary allows you to explore and access a wide range of POWER parameters.
- Resources include guides for using POWER services.
Core DAV Tools
The Core DAV Tools offer a range of functions for analyzing, measuring, and interacting with POWER data and maps. The Map Viewer Widget panel will display full screen depending on the size of the device. You can minimize the panel while interacting with the map viewer, rather than close the widget completely.
| Tool | Description |
|---|---|
| Single Point | The 'Single Point' tool provides access to near real-time data sets and plotting for a single coordinate (lat/lon). |
| Regional | The 'Regional' tool provides access to near real-time data sets by region up to 10 x 10 degrees (lat/lon). |
| Global | The 'Global' tool provides access to global climate temperature and temperature/moisture zones. |
| Visualize | The 'Visualize' tab contains a comprehensive list of monthly and annual data parameter map layers. |
| Graphing | The 'Graphing' tool provides various additional graphing capabilities for a single coordinate (lat/lon). |
| Reports | The 'Reports' tool provides you the ability to generate custom climatological reports and data for a single coordinate (lat/lon). |
| RASI | The 'RASI' projection tool provides future climate predictions for NASA sites. |
Map Viewer Widgets
The Map Viewer Widgets provided are interface tools used for viewing and interacting with maps and map layers. You can select from various basemaps, zoom in and out of the map, search by entering coordinates or an address, and locate your position on the map.
| Image | Description |
|---|---|
 | The 'Zoom In' button enlargers the map for an area of interest. |
 | The 'Zoom Out' decreases the map's zoom level, allowing you to view a larger geographic area with less detail. |
 | The 'Default Extent' widget resets the map view to its original extent. |
 | The 'My Location' widget allows the application to detect your IP location and zooms the map to that area. Accuracy may vary depending on your network and device. |
 | The 'Basemap' widget allows the application to toggle between various Esri basemaps. |
Application Version Number
The Application Version Number changes over time as updates modify the functionality and interface of the Data Access Viewer. Each version update does not address all known bugs or improvements. Therefore, knowing the version number is useful for three reasons: citing the POWER DAV as the service providing data, communicating with the POWER team to identify bugs or suggest improvements, and working with others to identify available functionality.
For more information about citing POWER, please refer to our referencing guide.
Comparative Analysis Tool
The Comparative Analysis Tool allows you to add multiple map layers from the "Visualize" tab. You can drag and drop as many parameters as you like from the "Visualize" tab to the Comparative Analysis Queue. Within the queue tab, you can choose layers to visualize and compare them in the map using an Esri swipe tool.
Resources and Acknowledgements
These additional features credit the project lead, outline privacy policies, and offer assistance in the form of documentation/tutorials.
POWER Map Layers
The 'POWER Visualize' tool provides you the ability to visualize global POWER parameters on a gridded map. Currently, Monthly and Annual data are available.
Visualize - Data Access Steps
1) Find the parameter, temporal level of interest, and grid (optional) in one of the dropdowns in the "Visualize" tool. 2) Use the 'Adjust Transparency' slider to the right of the selected parameter (under the 2 box icon) to adjust the parameter layer opacity. 3) Filter with the 'Adjust min and max display values' slider next to the right of the selected parameter (under the slider icon). 4) 'Add to comparative analysis queue' with the widget on the right. Then view the layer in the queue to the right of the map. 5) With multiple layers in comparative analysis, compare them on the left and right with the swipe tool (under the split square icon with 2 arrows). 6) Select a point on the map for data set values by location.
Reports Data Access
The 'POWER Reports Data Access' widget provides access to reports from 2001 through the most recent full year by a coordinate in a similar fashion to the 'POWER Single Point Data Access' widget. Steps and details for using this widget are shown below:
Reports - Data Access Steps
1) Choose a Report Type: You can select to view a report on either Climatic Design Conditions or a Windrose.
2) Enter lat/lon or add a point to map: Enter global coordinates in decimal degrees or make a selection on the map to retrieve coordinates at the map selected location. You can also clear the selected point off the map with the x button in the map pane.
3) Select Time Extent: You can select a start and end year from 2001 through the most recent full year.
4) Submit and Process: Once you have selected all data options, you can submit and retrieve the requested report as either an HTML or XLSX file.