Wind
Wind parameters available through the POWER API and DAV include wind speed and direction at various heights above the surface. The user community selection determines the exact height availability.
Mean Wind Speed and Wind Direction Parameters
The wind speed and wind direction parameters are to be used to determine the mean wind flow of a region rather than local area due to effects of buildings and local topography.
Corrected Wind Speed
In addition to the wind speed parameters available at set heights above surface, the POWER API allows the user to request a wind speed at a user defined height (between 10 and 300 m) for a particular surface type.
Equation: Corrected Wind Speed (Adjusted for Elevation)
| Surface | Definition | Surface | Definition |
|---|---|---|---|
| vegtype_1 | 35 m broadleaf-evergreen trees (70% coverage) | vegtype_7 | 0.6 m perennial ground cover (100%) |
| vegtype_2 | 20 m broadleaf-deciduous trees (75% coverage) | vegtype_8 | 0.5 m broadleaf shrubs (variable %) and ground cover |
| vegtype_3 | 20 m broadleaf and needleleaf trees (75% coverage) | vegtype_9 | 0.5 m broadleaf shrubs (10%) with bare soil |
| vegtype_4 | 17 m needleleaf-evergreen trees (75% coverage) | vegtype_10 | Tundra: 0.6 m trees/shrubs (variable %) and ground cover |
| vegtype_5 | 14 m needleleaf-deciduous trees (50% coverage) | vegtype_11 | Rough bare soil |
| vegtype_6 | Savanna: 18 m broadleaf trees (30%) and ground cover | vegtype_12 | Crop: 20 m broadleaf-deciduous trees (10%) and wheat |
| vegtype_20 | Rough glacial snow/ice | seaice | Smooth sea ice |
| openwater | Open water | airportice | Airport: flat ice/snow |
| airportgrass | Airport: flat rough grass |
Wind Speed Validation
This section compares MERRA-2 10 m wind speed to observations reported to the National Center for Environmental Information (NCEI – formerly National Climatic Data Center). Selected surface sites from the NCEI Integrated Surface Database (ISD) files are used for the hourly MERRA-2 comparisons. Global "Summary of the Day" (GSOD) files are used for the comparison to the daily mean MERRA-2 temperature.
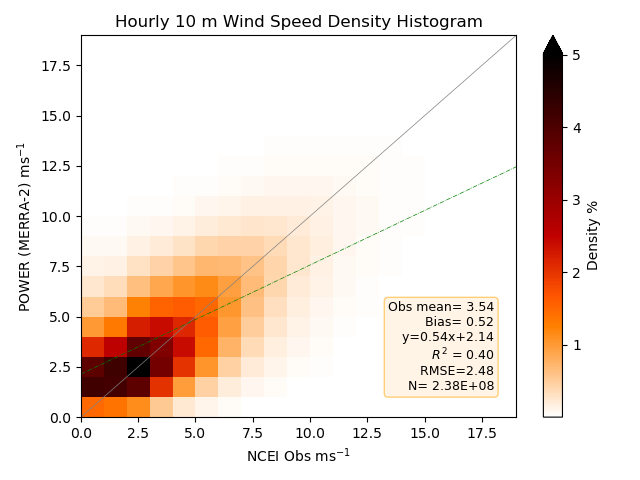
Hourly
Hourly Wind Speed
Density plot of the 2-D histograms comparing MERRA-2 hourly 10 m wind speed with station observations from the selected NCEI ISD files for the years 2001–2020. Darker reds indicate a higher number of matched pairs within the 2-D histogram.
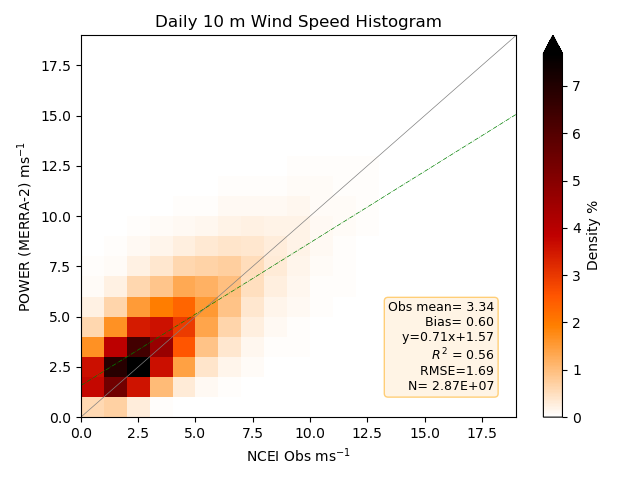
Daily Average
Daily Average 10 m Wind Speed
Density plot of the 2-D histograms comparing MERRA-2 daily wind speed with station observations from the NCEI GSOD files for 1981–2020. Darker reds indicate a higher number of matched pairs within the 2-D histogram.
Wind Direction
Wind Direction at a given height in degrees is the meteorological convention. The meteorological convention gives the direction from which the wind originates, and wind direction is measured in degrees clockwise from due north.
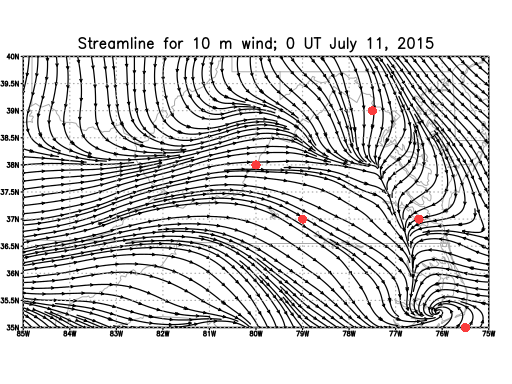
The computation of wind direction from MERRA-2 u and v components is based upon the information from NCAR/UCAR/EOL's quick reference on wind direction. Verification of the equations is accomplished with the usage of MERRA-2 10 m winds from July 11, 2015; shown in this table:
| Latitude | Longitude | u (m s⁻¹) | v (m s⁻¹) | Direction |
|---|---|---|---|---|
| 38.0°N | 80.0°W | 1.14718 | 0.00922 | 270.46° |
| 37.0°N | 79.0°W | 1.53487 | -0.89496 | 300.25° |
| 37.0°N | 76.5°W | -1.53666 | 0.21723 | 81.95° |
| 35.0°N | 75.5°W | 1.85421 | 2.19976 | 220.13° |
| 39.0°N | 77.5°W | -0.09501 | 1.50678 | 3.61° |
These locations are indicated on the streamline map below as the red circles.
Hourly Wind Direction Validation
Hourly 10 m Wind Direction Contingency Chart
Diagram of the hourly wind direction contingency comparison (shown as percentage) between MERRA-2 10 m wind direction and the selected NCEI ISD files for the years 2001–2019. Hourly wind directions for both are categorized into octads, then 2-D histograms relate the directions to each other. 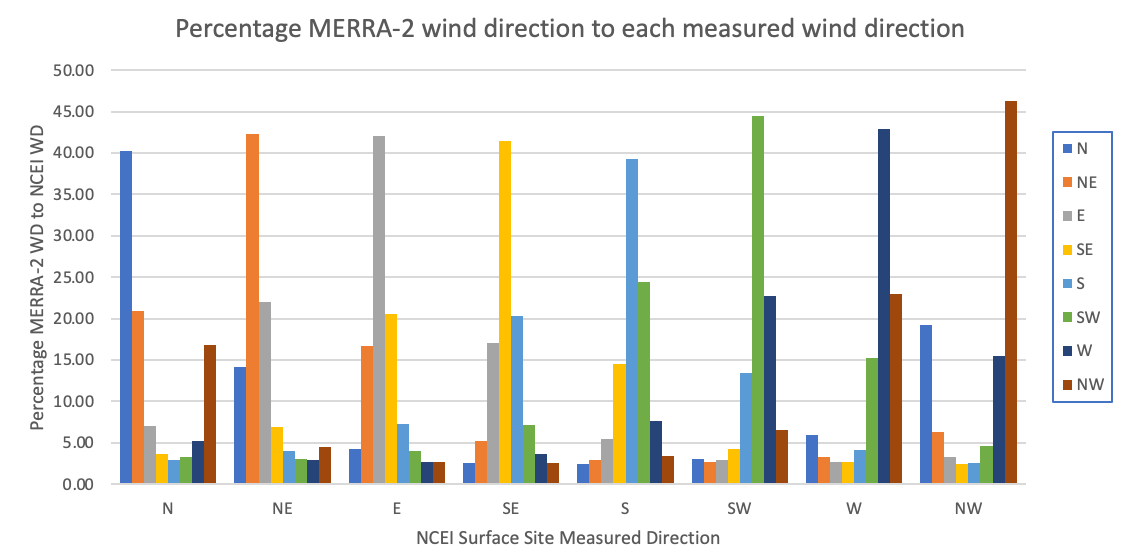
Click to Expand: Python Code
1 2 3 4 5 6 7 8 9 10 11 12 13 14 15 16 17 18 19 20 | |
Reference
Chandler, William S., C.H. Whitlock, P.W. Stackhouse, Jr., 2005: Determining Wind Resources as a Function of Surface Roughness and Height from NASA Global Assimilation Analysis. Proceedings of the International Solar Energy Society 2005 Solar World Congress, August 6–12, Orlando, Florida