Specific Humidity
Validation
Scatter plot of the re-gridded MERRA-2 daily specific humidity vs. the daily station observation values from the NCEI GSOD files for every third year from 1981–2014.
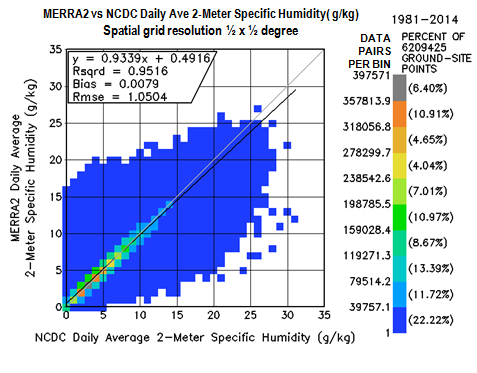
The color bar along the right side of the scatter plot provides a measure of the distribution of the NCEI and MERRA-2 specific humidity pairs in bins of 1 g/kg. For example, the left column along the vertical color bar shows that each data point in dark blue represents the number of ground site/MERRA-2 data pairs within 10 % (i.e., ≤39,757) of the maximum number of data pairs within a 1 g/kg bin in the plot (i.e., 397,571). Additionally, from the right side of the vertical color bar, all of the points shown in dark blue contain 22.22 % of the total number of ground site/MERRA-2 data pairs (6,209,425). The remaining 77.8 % of the data pairs are concentrated along the 1:1 grey line.