Relative Humidity
The relative humidity (RH) values in the POWER Archive are calculated from pressure (Pa in kPa), dry-bulb temperature (Ta in °C), and mixing ratio (e.g. specific humidity, q in kg/kg), parameters that are available from the re-gridded MERRA-2 and represents estimates at two meters above the local surface averaged over the original source spatial resolution. The following is a summary of the expressions used to calculate RH. The units are indicated in square brackets.
Equation
Since water vapor and dry air (a mixture of inert gases) can be treated as ideal gases, it can be shown that (Iribarne and Godson, pg 74, Eq. 76; note that the symbol, r, use in Eq. 76 for the mixing ratio has been replaced by w and the factor of 10 has been added to convert the units to hPa.):
There is no exact consensus for the gas constants past three significant digits, therefore the value of the ratio is kept to three significant digits. The mixing ratio is related to specific humidity by the relation (Jupp, 2003, pg. 37):
Combining Equation 2 and Equation 4 leads to the following expression for e in terms of q:
An eighth-order polynomial fit (Flatau et al., 1992) to measurements of vapor pressure over ice and over water provides an expression to calculate the saturated water vapor pressure. The eighth-order fit for e_{wsat} is given by:
Coefficients
Coefficients for e_{sat} over water and over ice and the temperature range over which the coefficient are applicable.
| Over Water (Valid: -85 °C to 70 °C) | Over Ice (Valid: -90 °C to 0 °C) |
|---|---|
| A1w = 6.11583699 | A1i = 6.09868993 |
| A2w = 0.444606896 | A2i = 0.499320233 |
| A3w = 0.143177157E-1 | A3i = 0.184672631E-1 |
| A4w = 0.264224321E-3 | A4i = 0.402737184E-3 |
| A5w = 0.299291081E-5 | A5i = 0.565392987E-5 |
| A6w = 0.203154182E-7 | A6i = 0.521693933E-7 |
| A7w = 0.702620698E-10 | A7i = 0.307839583E-9 |
| A8w = 0.379534310E-13 | A8i = 0.105758160E-11 |
| A9w = -0.321582393E-15 | A9i = 0.161444444E-14 |
Note
Only the relative humidity over water is calculated and provided in the POWER Archive consistent with the values reported by the National Weather Service.
Validation
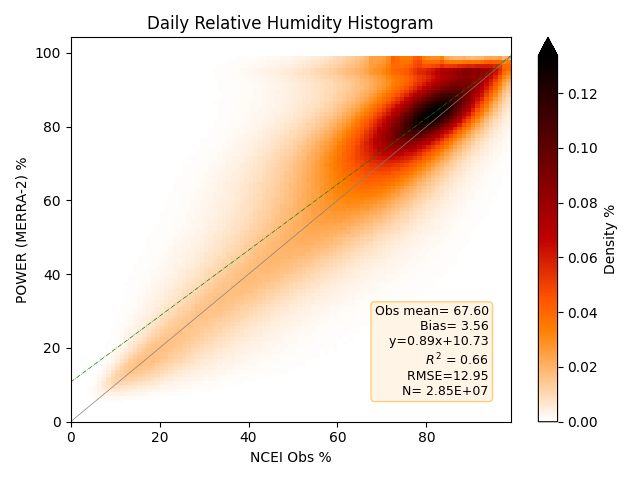
Daily Relative Humidity
Density plot of the 2-D histograms comparing MERRA-2 daily relative humidity with station-derived values from observations from the selected NCEI ISD files for the years 2001–2023. Darker reds indicate a higher number of matched pairs within the 2-D histogram. Both POWER RH and NCEI RH are derived from respective dry bulb and dew point values using the relationships discussed above.