Surface Pressure
This section compares MERRA-2 surface pressure to observations reported to the National Center for Environmental Information (NCEI – formerly National Climatic Data Center). Selected surface sites from the NCEI Integrated Surface Database (ISD) files are used for the hourly MERRA-2 comparisons. Global "Summary of the Day" (GSOD) files are used for the comparison to the daily mean MERRA-2 surface pressure. Because of the difference in the grid box topography of MERRA-2 and the site elevation, the MERRA-2 surface pressure is adjusted by the difference. See the info box below on the hypsometric equation.
Hourly
Hourly Surface Pressure (Adjusted)
Density plot of the 2-D histograms comparing MERRA-2 hourly adjusted surface pressure with station observations from the selected NCEI ISD files for the years 2001–2020. Darker reds indicate a higher number of matched pairs within the 2-D histogram.
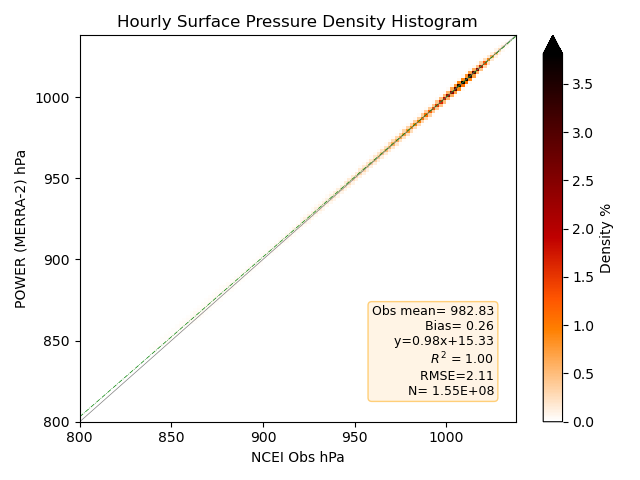
The hourly validation for the adjusted surface pressure shows good agreement with clustering around the 1:1 correlation line, especially for values above 700 hPa.
Daily Average
The daily mean surface pressure is taken directly from the re-gridded MERRA-2 data. It represents estimates of atmospheric pressure at 2 m above the local surface averaged from the original source spatial resolution.
Daily Surface Pressure (Adjusted)
Density plot of the 2-D histograms comparing MERRA-2 daily adjusted surface pressure with station observations from the NCEI GSOD files for 1981–2020. 
Hypsometric Equation for Adjustment of Surface Pressure
The elevation of the MERRA-2 grid box is the mean elevation of the earth’s surface under the grid. In complex terrain one might expect to see a difference between the MERRA-2 elevation and that of the surface site resulting in a difference between the MERRA-2 pressure and that reported by the surface site. The Surface Pressure (Hypsometric Equation) scatter plot illustrates the improvements in the agreement between the MERRA-2 estimates of pressure and observational data by adjusting the MERRA-2 pressure using the hypsometric equation. The hypsometric equation, relates the thickness (h) between two isobaric surfaces to the mean temperature (T) of the layer as:
Solving the hypsometric equation for p1 and substituting the known values for z1, z2, p1, R, and g, gives the adjusted MERRA-2 surface pressure (p1) at the elevation of the NCEI surface site.
Plot Notes
- The legend on each density plot gives the site observation mean, bias with MERRA-2, root mean squared error (RMSE), equation of the line for the linear least squares fit, coefficient of determination, and number of data pairs to the plotted values.
- The color bar along the right side of the density plot provides a measure of the frequency of the data pairs per bin in plot.