Precipitation
This section compares MERRA-2 precipitation to observations reported to the National Center for Environmental Information (NCEI – formerly National Climatic Data Center). Selected surface sites from the NCEI Integrated Surface Database (ISD) files are used for the hourly MERRA-2 comparisons. Global "Summary of the Day" (GSOD) files are used for the comparison to the daily accumulated MERRA-2 precipitation.
Hourly
Hourly Precipitation
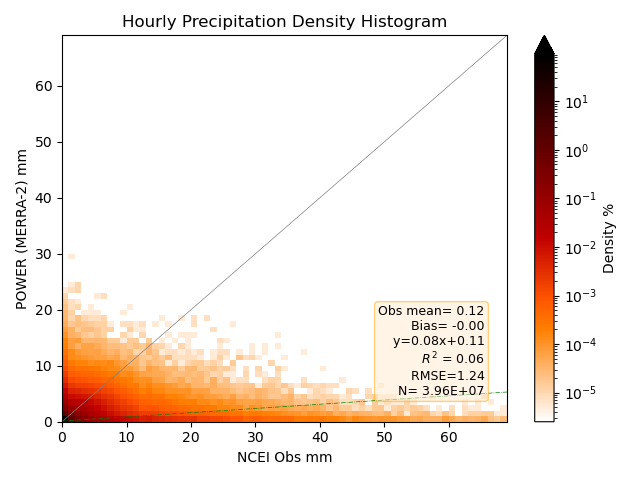
Density histogram plot of the MERRA-2 hourly precipitation vs. the hourly station observation values from the selected NCEI ISD files for the years 2001–2023.
Daily Precipitation
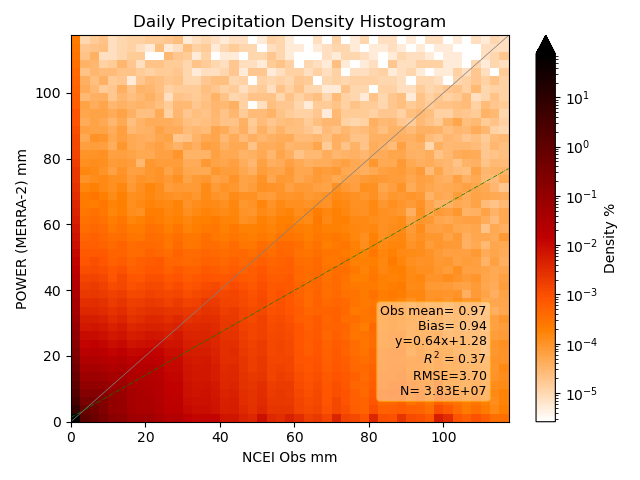
Density histogram plot of MERRA-2 daily precipitation vs. the daily station observation values from the NCEI GSOD files for 1981–2023.
Daily Accumulations
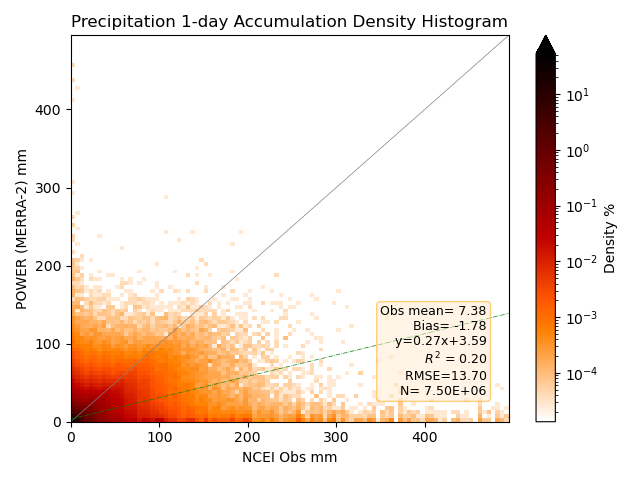
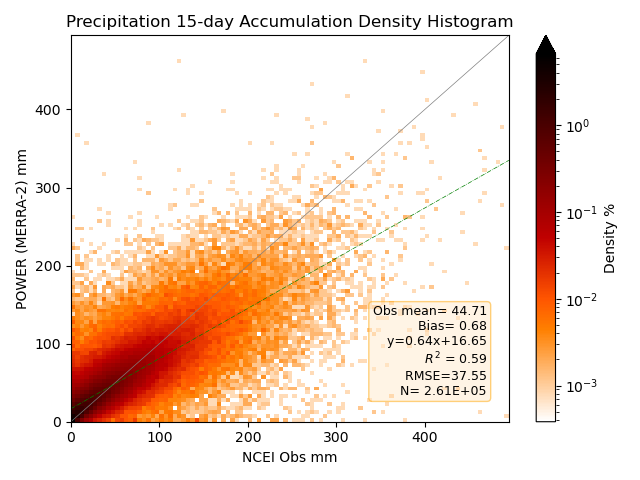
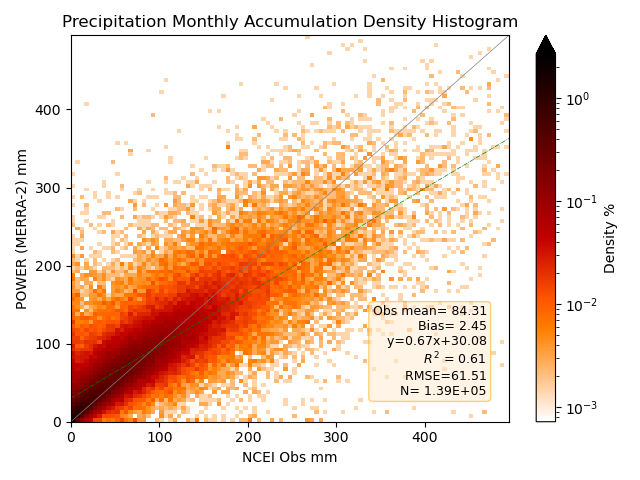
The statistics and density plots below are calculated only when the NCEI observation reports positive precipitation. The density plots are shown with a logarithmic color bar scale to show histogram bins away from the origin.
| Accumulated Days | Site Mean | Slope | Intercept | Rsqrd | Bias | RMSE |
|---|---|---|---|---|---|---|
| 1 | 7.38 | 0.27 | 3.59 | 0.20 | -1.78 | 13.70 |
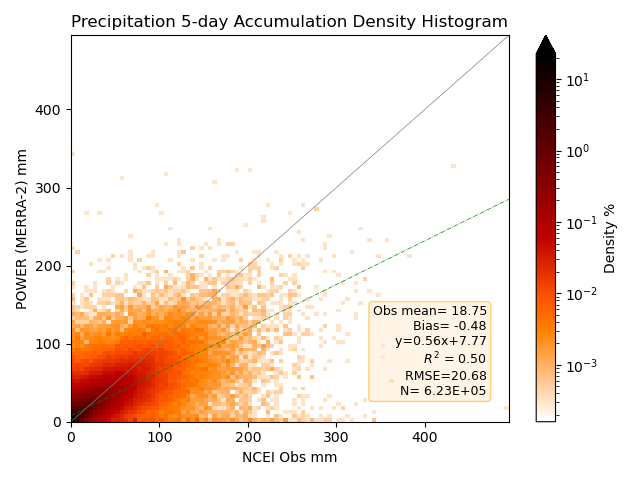
| 5 | 18.75 | 0.56 | 7.77 | 0.50 | -0.48 | 20.68 |
| 15 | 44.71 | 0.64 | 16.65 | 0.59 | 0.68 | 37.55 |
| Month | 84.31 | 0.67 | 30.08 | 0.61 | 2.45 | 61.51 |
One-Day Accumulated Precipitation
Density histogram plot of MERRA-2 one-day accumulated precipitation vs. the daily station observation values from the NCEI GSOD files for 1981–2023.
Five-Day Accumulated Precipitation
Density histogram plot of the re-gridded MERRA-2 five-day accumulated precipitation vs. the daily station observation values from the NCEI GSOD files for 1981–2023.
15-Day Accumulated Precipitation
Density histogram plot of the re-gridded MERRA-2 15-day accumulated precipitation vs. the daily station observation values from the NCEI GSOD files for 1981–2023.
Monthly Accumulated Precipitation
Density histogram plot of the re-gridded MERRA-2 monthly accumulated precipitation vs. the daily station observation values from the NCEI GSOD files for 1981–2023.
Plot Notes
- The legend on each density plot gives the site observation mean, bias with MERRA-2, root mean squared error (RMSE), equation of the line for the linear least squares fit, coefficient of determination, and number of data pairs to the plotted values.
- The color bar along the right side of the density plot provides a measure of the frequency of the data pairs per bin in plot.
Contingency Table
Many methods exist when it comes to the validation of precipitation (Yates, 2006; Ebert, 2007). Density scatter plots are a useful way to describe and display the validation statistics. However, days with little or no precipitation dominate the density scatter plots of the precipitation validation due to the random nature of the daily precipitation. Meanwhile, days with heavy precipitation are less frequent. Categorical verification, in this case contingency tables, offer another way to examine the daily precipitation data. The contingency tables below show the cases when the MERRA-2 daily precipitation and ground site daily precipitation:
- Measured no precipitation on the same days ("correct negative").
- Measured precipitation on the same days ("hits"; regardless of amount).
- MERRA-2 measured precipitation while ground site does not ("false alarms").
- MERRA-2 measured no precipitation while ground site did ("misses").
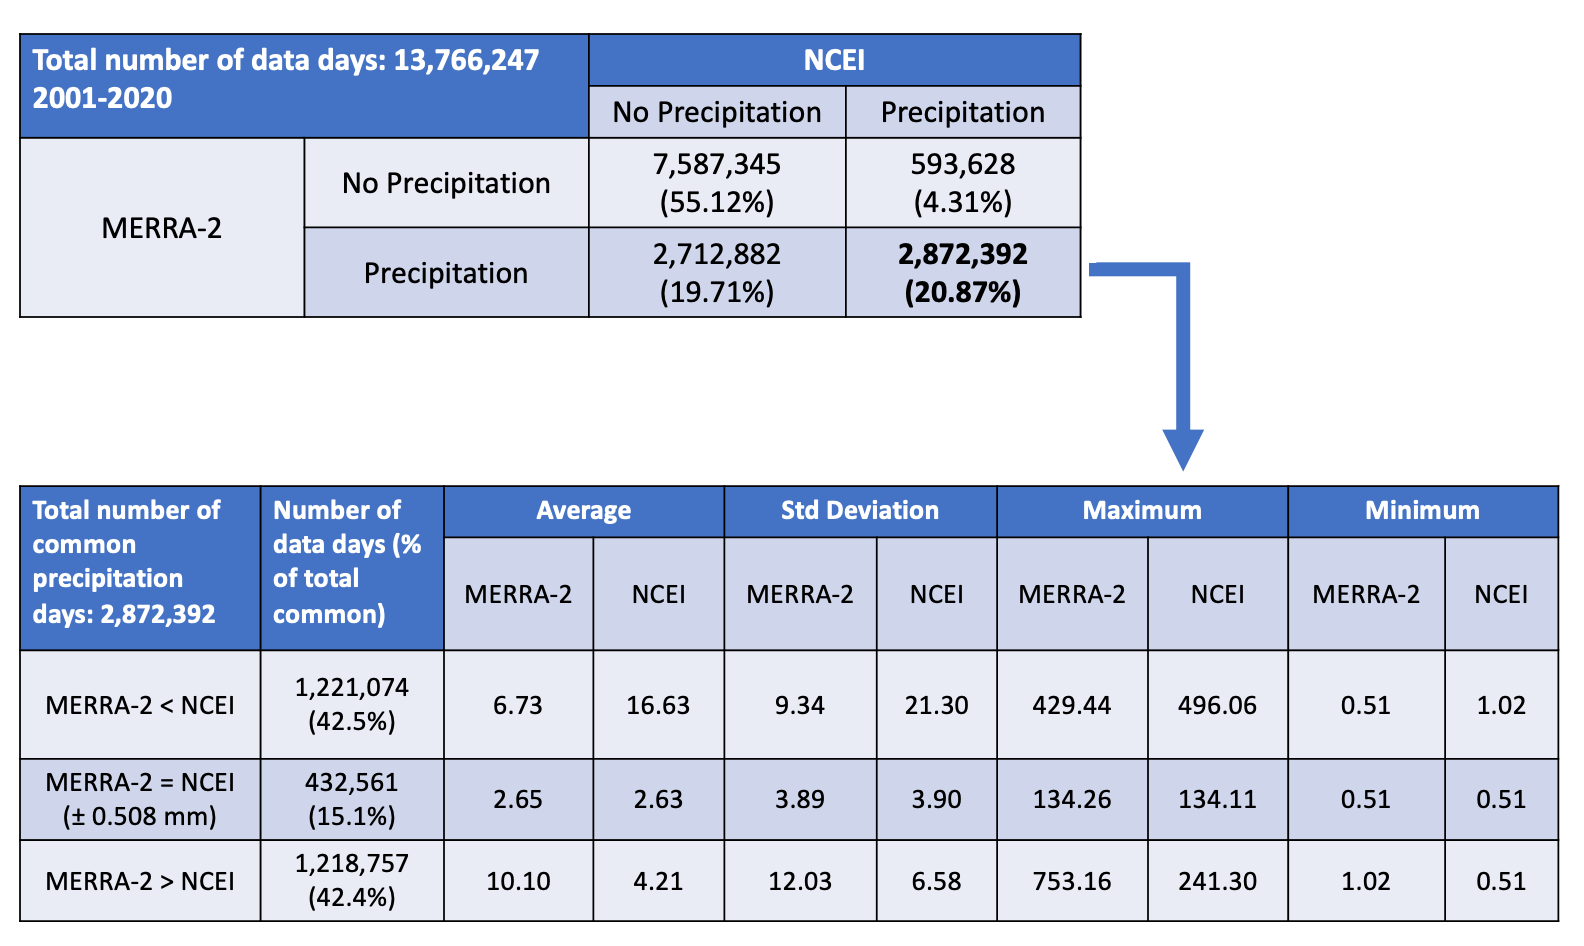
For this contingency table analysis of the MERRA-2 daily precipitation, all the days when the ground site/MERRA-2 data pairs measured a valid precipitation amount above the measurement accuracy of the NCEI ground site instruments (0.508 mm), including days with no precipitation, were counted for the 2001–2020 period. These "data days" total greater than 13.7 million days. The top table in the Hits Contingency Table shows a breakdown of the four categories mentioned previously, with the MERRA-2 data presented by the "rows" on the left side of the table and the NCEI ground site data presented by the "columns" on the top side of the table. Row 1 and Column 1 depict the "No Precipitation" category for the MERRA-2 and NCEI ground site data, respectively. Where Row 1 and Column 1 intersect shows the total number of data days (7,587,345) where both data sets measured less than 0.508 mm on the same days ("correct negative"). This represented 55% of the total data days counted.
Hits: Row 2 and Column 2 depict the "Precipitation" categories for the MERRA-2 and NCEI ground site data, respectively. Their intersection shows the total number of data days (2,872,392) where both data sets measured precipitation greater than 0.508 mm on the same days ("hits"). This represented 21% of the total data days counted. The "hits" category is broken down further in sub-categories, depicted in the lower table in the Hits Contingency Table, along with statistics. The sub-categories consist of data days when the MERRA-2 precipitation is less than the NCEI ground site, when the MERRA-2 precipitation is greater than the NCEI ground site, and when the MERRA-2 precipitation is "equal" to the NCEI ground site. "Equal" meaning within the measurement accuracy of the NCEI ground site instruments (0.508 mm). Out of the total number of data day "hits", 15% data days occur when the MERRA-2 precipitation is equal to the NCEI ground site precipitation. Under equal conditions, MERRA-2 precipitation and NCEI ground site precipitation share similar averages, standard deviations, maximum values, and minimum values. MERRA-2 precipitation is less than the NCEI ground site precipitation on 43% data days out of the total number of data day "hits". As expected, the MERRA-2 precipitation average and standard deviations are roughly 2.5 times less than the NCEI ground site precipitation average and standard deviations. The MERRA-2 precipitation is more than the NCEI ground site precipitation on 42% data days out of the total number of data day "hits". As expected, the MERRA-2 precipitation average and standard deviations are roughly two times more than the NCEI ground site precipitation average and standard deviations.
Hits Contingency Table
Contingency table with focus on the "Hits" category between MERRA-2 precipitation and NCEI GSOD data for 2001–2020.
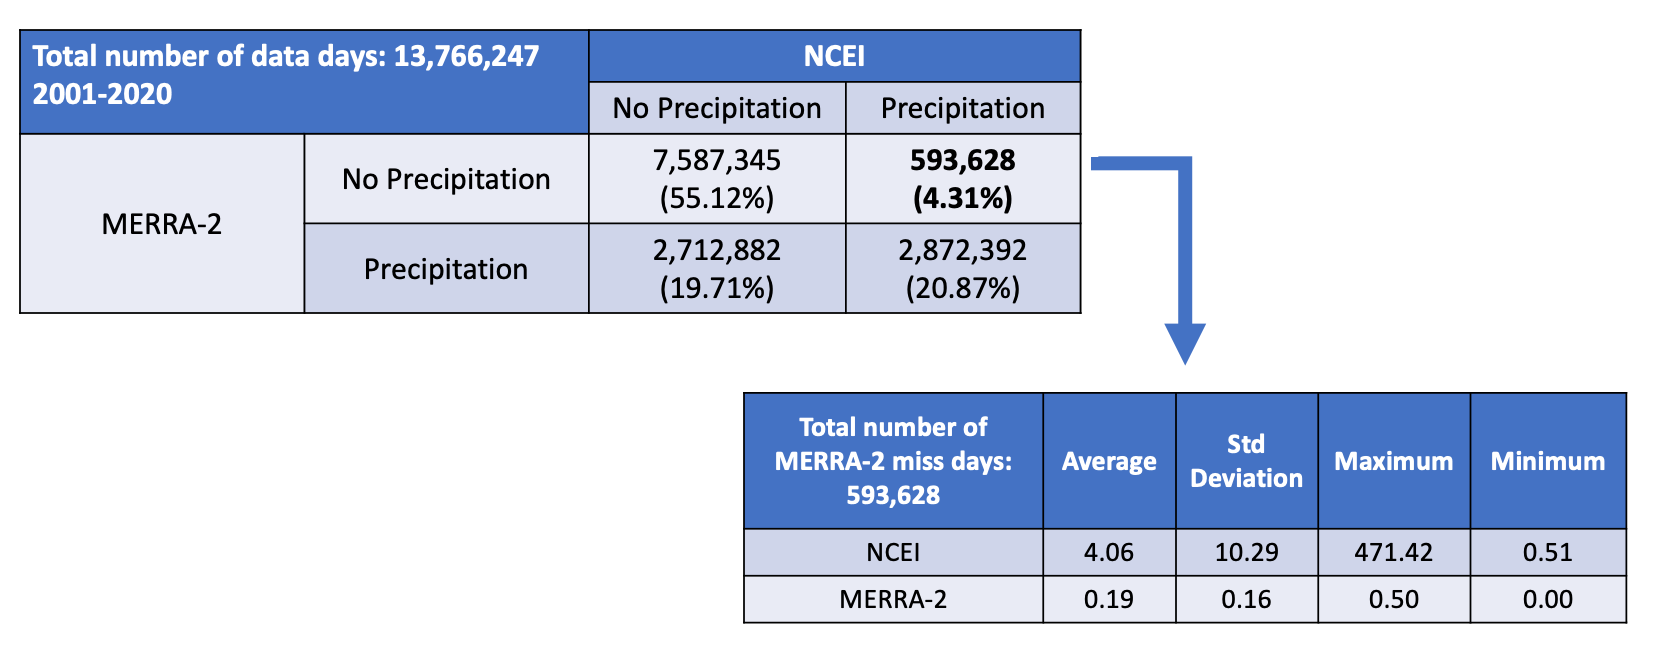
Misses: In the contingency table above, Row 1 and Column 2 depict the "No Precipitation" and "Precipitation" categories for the MERRA-2 and NCEI ground site data, respectively. Their intersection shows the total number of data days (593,628) when the MERRA-2 precipitation data measured no precipitation while the NCEI ground site precipitation data measured precipitation on the same days ("misses"). This represented 4% of the total data days counted. The "misses" category is broken down further, depicted below in the Misses Contingency Table, along with statistics. The tables show the data days when the MERRA-2 precipitation has no precipitation and the NCEI ground site has a precipitation amount greater than the measurement accuracy of the NCEI ground site instruments (0.508 mm). In these cases, the NCEI ground site precipitation has an average of 4.06 mm, a standard deviation of 10.29 mm, a maximum value of 471.42 mm, and a minimum value of 0.51 mm. Also included in the table are the statistics for the site data since the comparisons are based on accuracy amounts.
Misses Contingency Table
Contingency table with focus on the "Misses" category between MERRA-2 precipitation and NCEI GSOD data for 2001–2020.
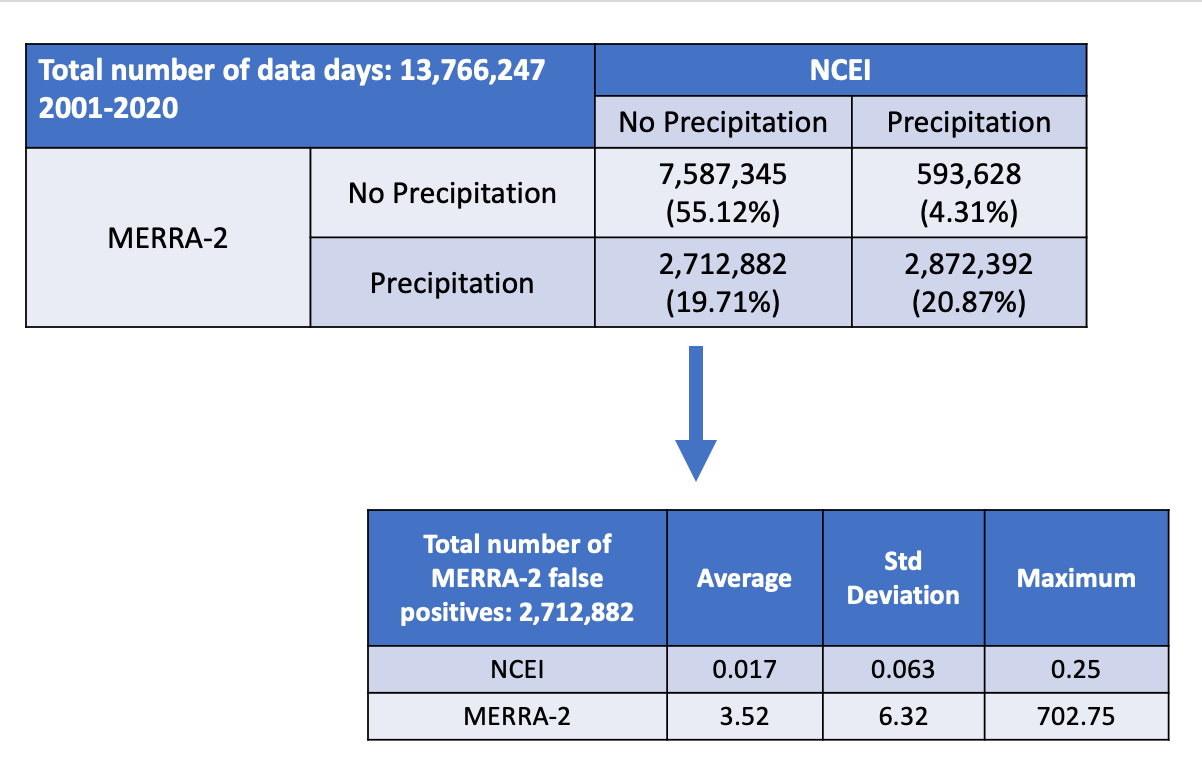
False Alarms: Row 2 and Column 1 depict the "Precipitation" and "No Precipitation" categories for the MERRA-2 and NCEI ground site data, respectively. Their intersection shows the total number of data days (2,712,882) where the MERRA-2 precipitation data measured precipitation while the NCEI ground site precipitation data measured no precipitation on the same days ("false alarms"). This represented 20% of the total data days counted. The "false alarm" category is depicted in the lower table in the False Alarms Contingency Table, along with statistics. The table shows the data days when the MERRA-2 precipitation measured precipitation and the NCEI ground site measured a precipitation amount less than and equal to the measurement accuracy of the NCEI ground site instruments. In these cases, the MERRA-2 precipitation has an average of 3.52 mm, a standard deviation of 6.32 mm, a maximum value of 702.75 mm.
False Alarms Contingency Table
Contingency table with focus on the "False Alarms" category between MERRA-2 precipitation and NCEI GSOD data for 2001–2020.
The findings from the contingency tables show additional information not easily seen in the density scatter plots in the Precipitation Overview. On data days when the MERRA-2 precipitation measured no precipitation, it agreed with the NCEI ground site precipitation 55% of the time ("correct negatives") and only disagreed 4% of the time ("misses"). The percentage of "misses" is low compared to the other three categories in the table, with the NCEI ground site precipitation measurement average only being 4 mm. On data days when the MERRA-2 precipitation measured precipitation, the NCEI ground site also measured precipitation 20% of the time ("hits") but disagreed about the same percentage of the time ("false alarms"). On data days when the NCEI ground site measures precipitation, it is encouraging to note MERRA-2 predicts precipitation on the same data days more often than it does not.
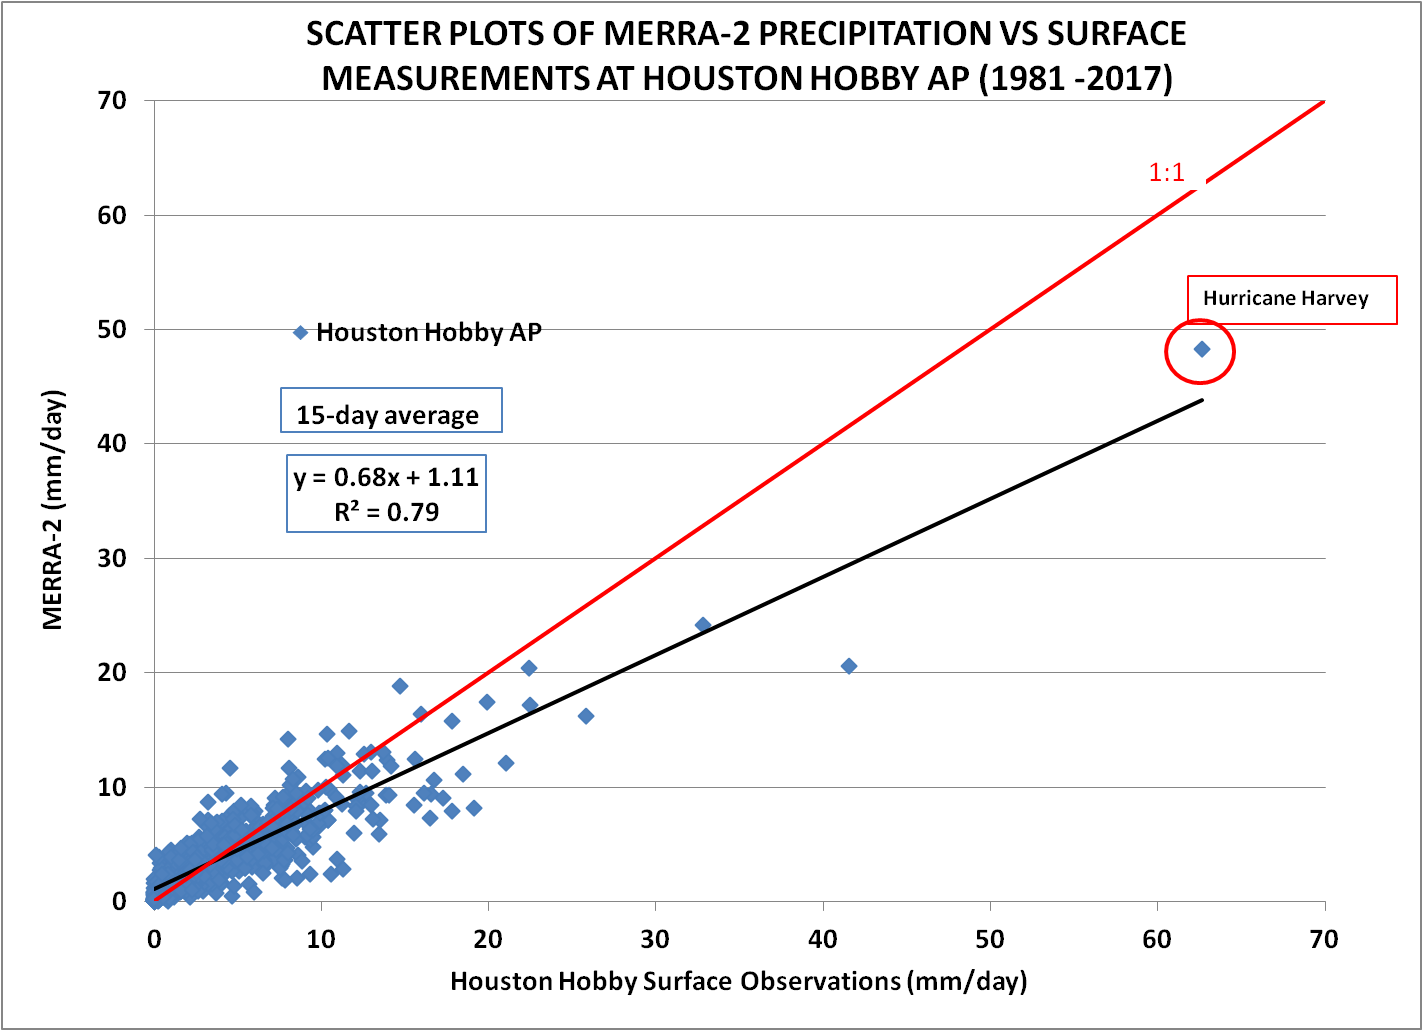
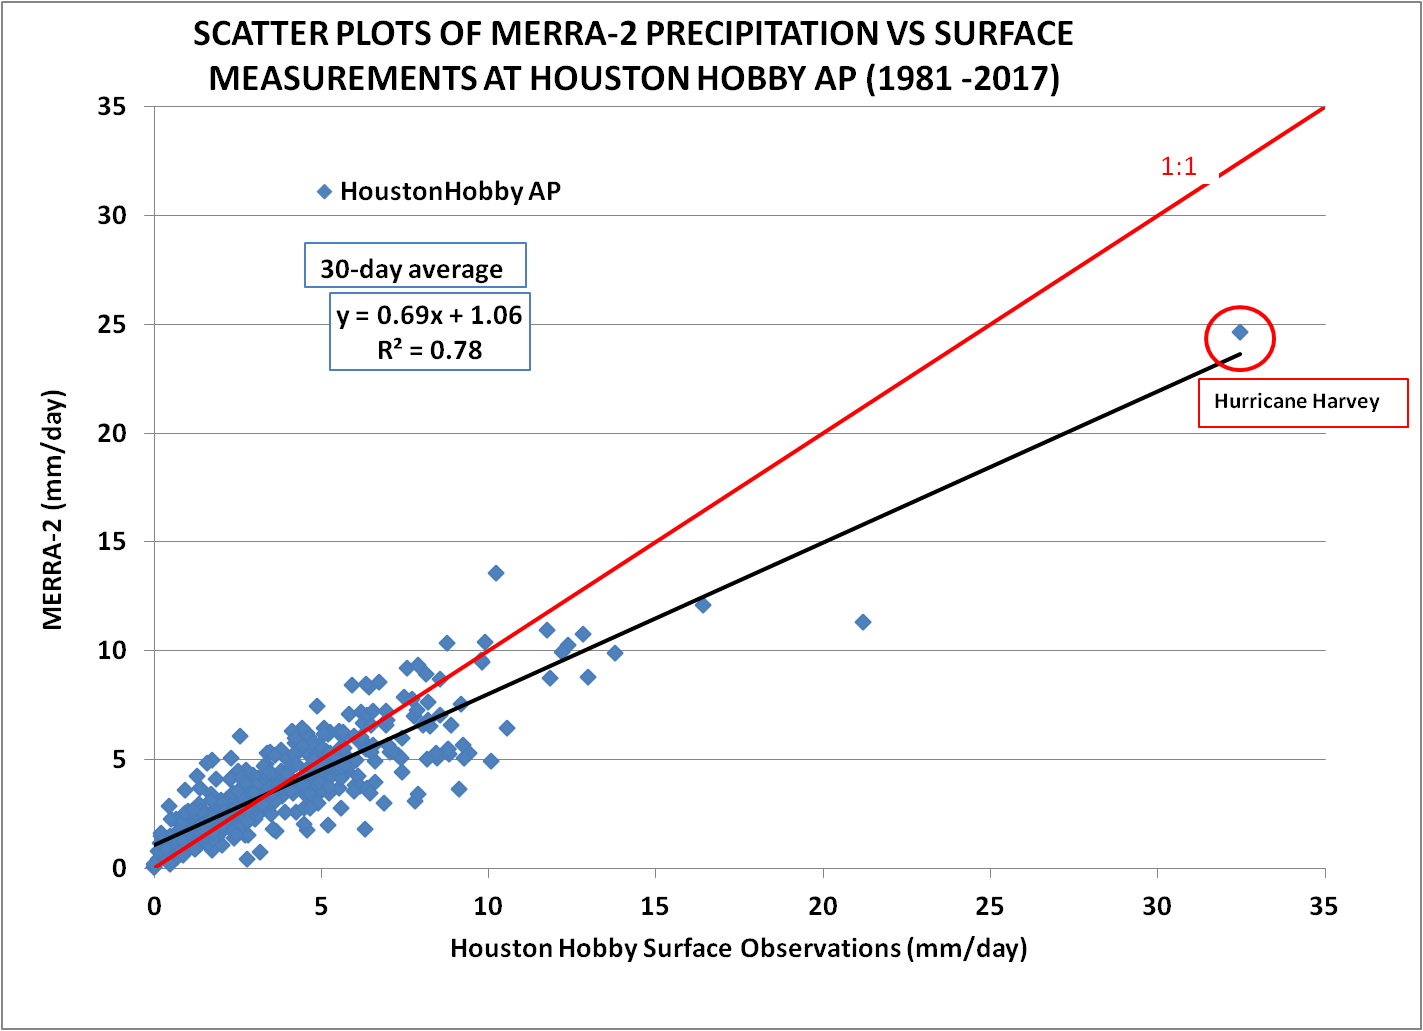
Localized Comparison
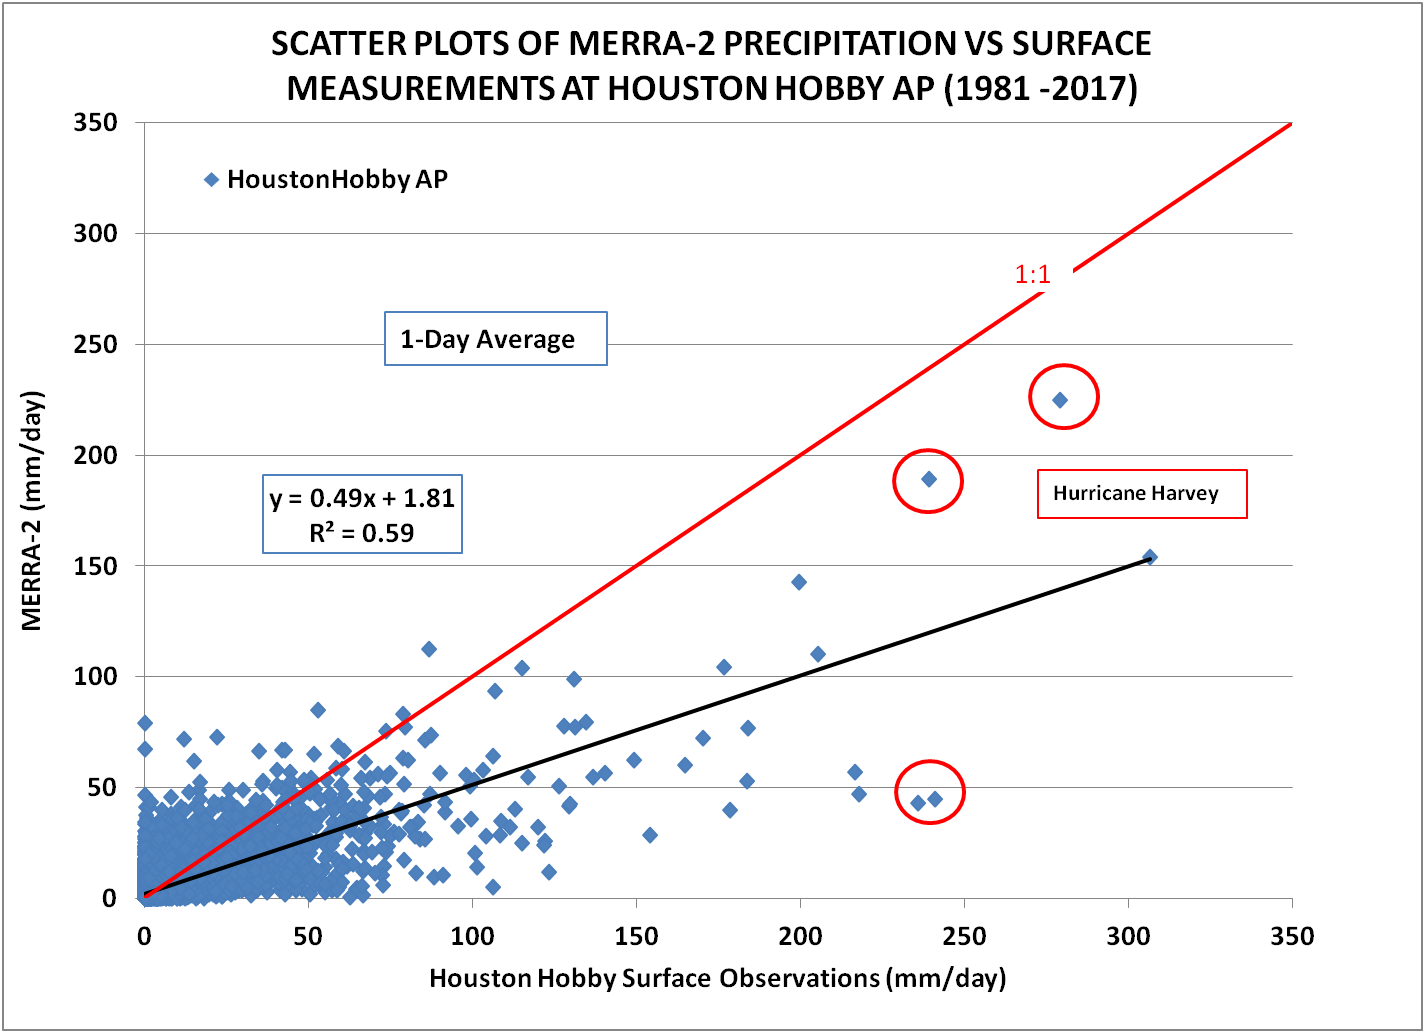
The scatter plots below provide a global perspective covering a wide range of precipitation as well as ground station with varying levels of quality control. The ability of the MERRA-2 to provide precipitation data for local applications can be assessed in the plots where the daily averaged MERRA-2 precipitation associated with the half-degree cell covering the Houston, Texas region is plotted against the corresponding daily averaged values from surface measurements at the Houston Hobby airport. The plots cover the time period 1981–2017. Note, here again as in the data from a global perspective, the agreement improves as the averaging period increased from 1-day through 30-days, and as with the data in the Accumulated Precipitation Scatter Plots (below) the improvement is marginal after 5-days. The data points circled in red are from the time period that Hurricane Harvey passed over the Houston area.
Success
The localized day based accumulated precipitation time series plots show high correlation between MERRA-2 and the surface observations. Similar results to those below were also observed at other surface stations in Texas and in the Louisiana.
Localized One-Day Accumulated Precipitation
Time series plot of the re-gridded MERRA-2 one-day accumulated precipitation vs. the daily station observations from William P. Hobby Airport, Houston, TX from 1981–2017.
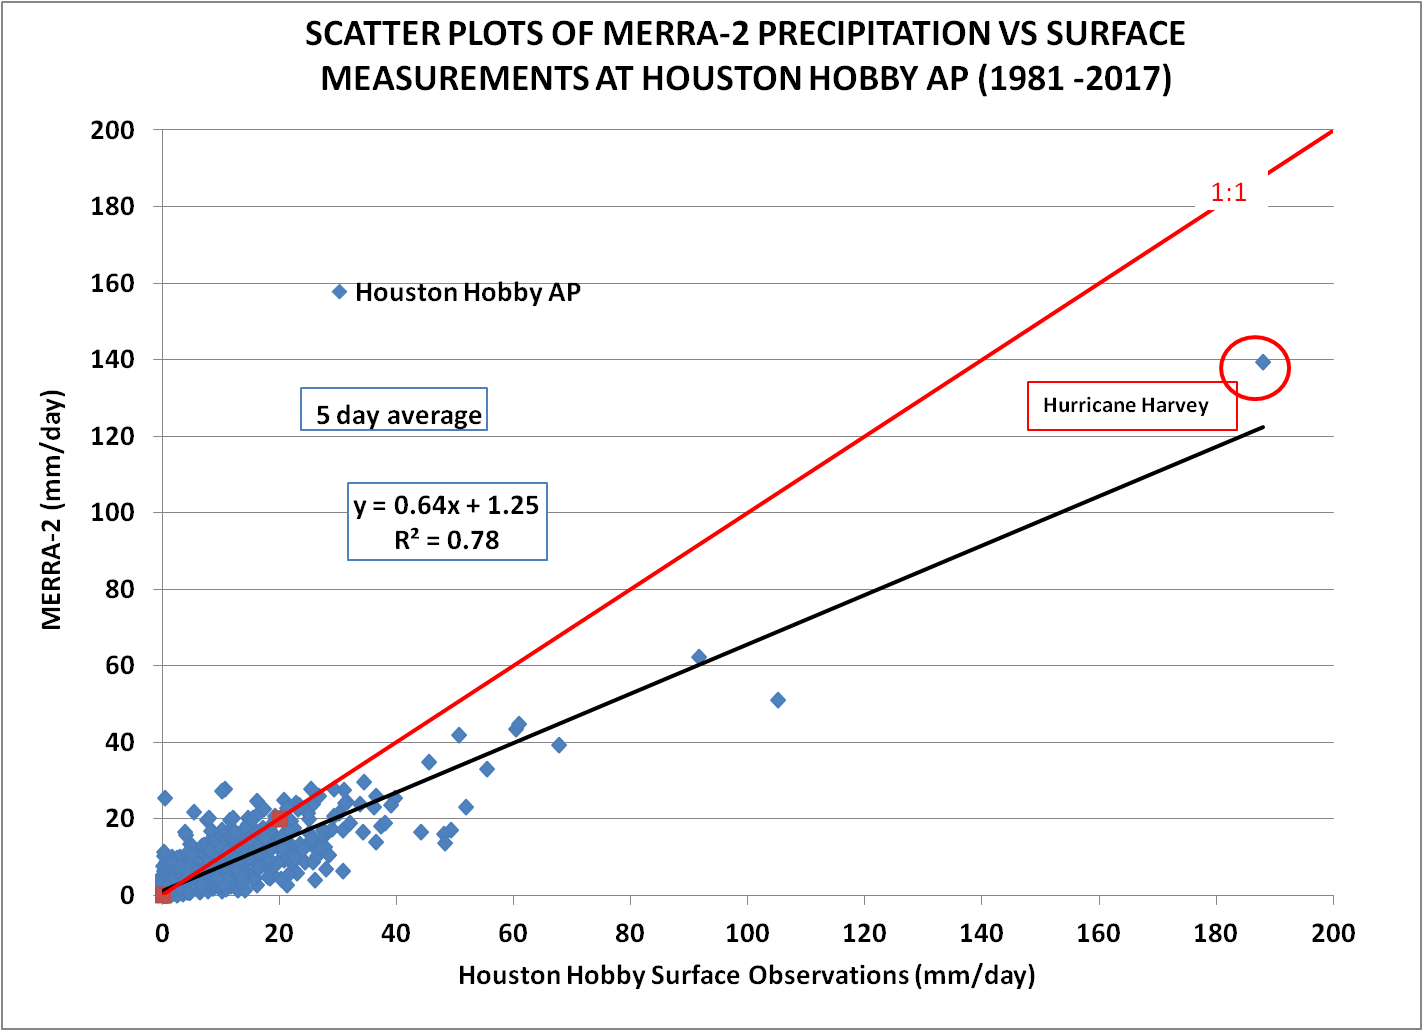
Localized Five-Day Accumulated Precipitation
Time series plot of the re-gridded MERRA-2 five-day accumulated precipitation vs. the daily station observations from William P. Hobby Airport, Houston, TX from 1981–2017.
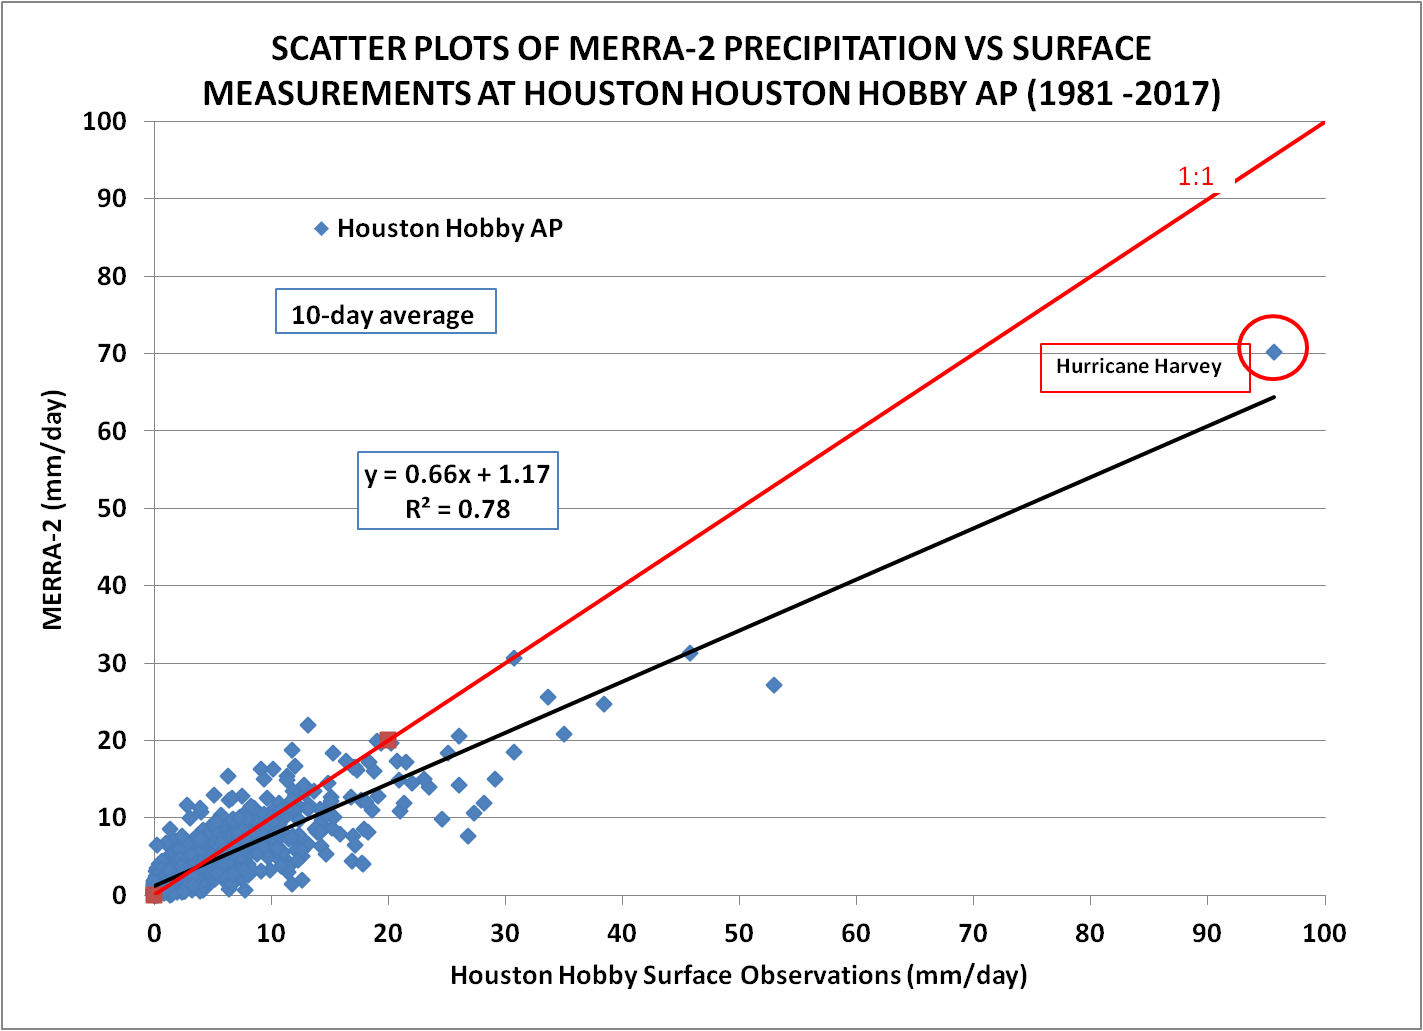
Localized 10-Day Accumulated Precipitation
Time series plot of the re-gridded MERRA-2 10-day accumulated precipitation vs. the daily station observations from William P. Hobby Airport, Houston, TX from 1981–2017.
Localized 15-Day Accumulated Precipitation
Time series plot of the re-gridded MERRA-2 15-day accumulated precipitation vs. the daily station observations from William P. Hobby Airport, Houston, TX from 1981–2017.
Localized 30-Day Accumulated Precipitation
Time series plot of the re-gridded MERRA-2 30-day accumulated precipitation vs. the daily station observations from William P. Hobby Airport, Houston, TX from 1981–2017.
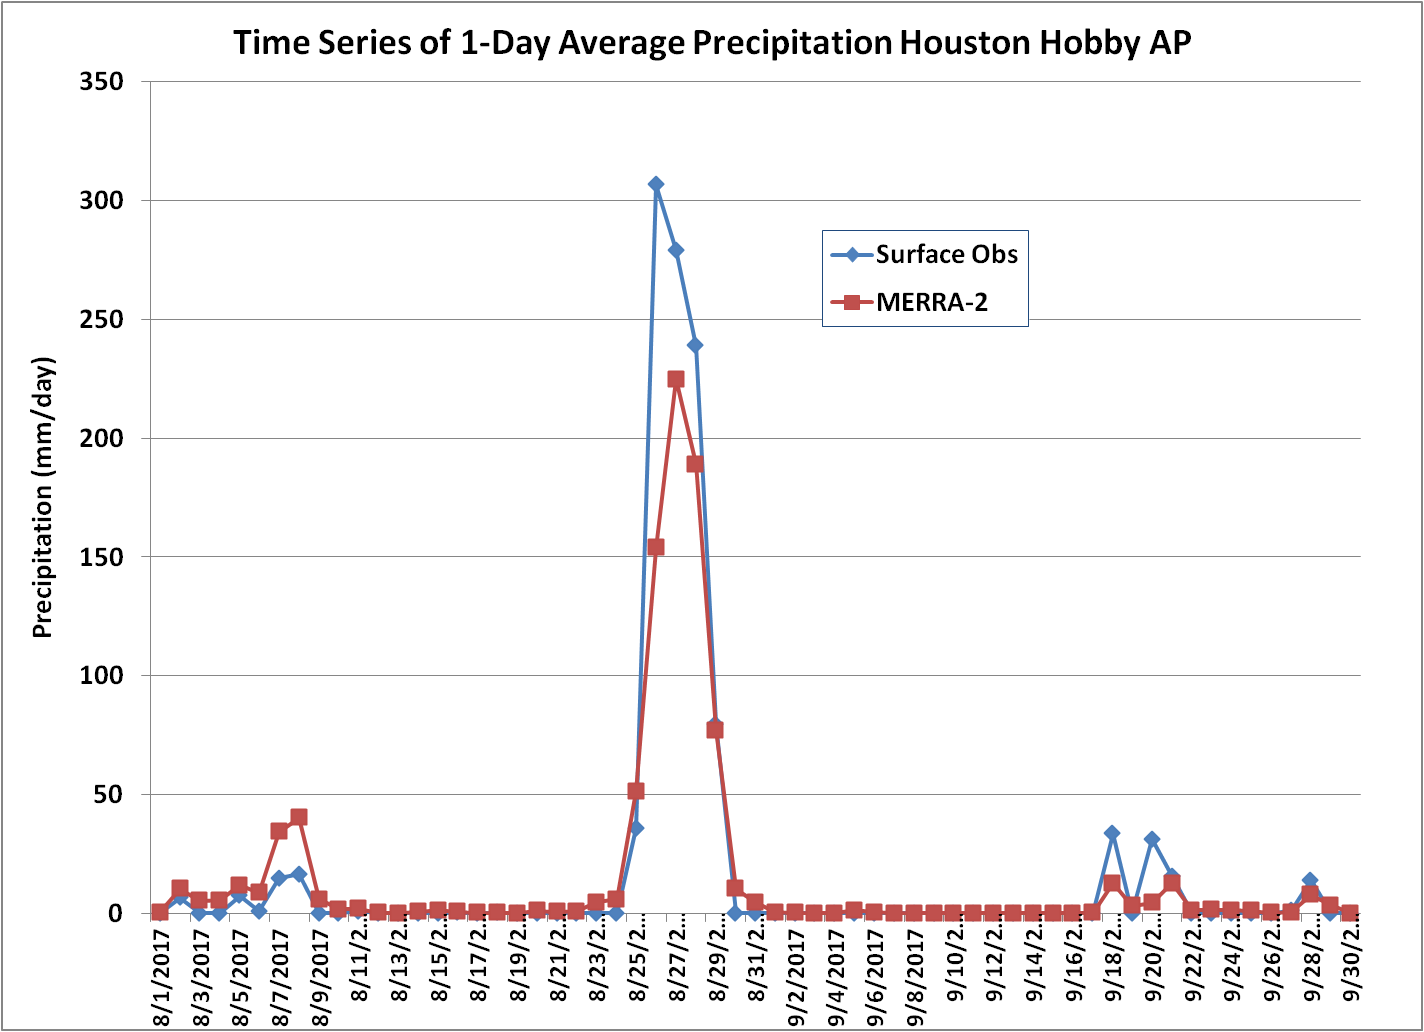
Localized Hurricane Harvey
Time series plot of the one-day average precipitation covering Hurricane Harvey (i.e., August 1, 2017 to September 30, 2017)
MERRA-2 vs IMERG
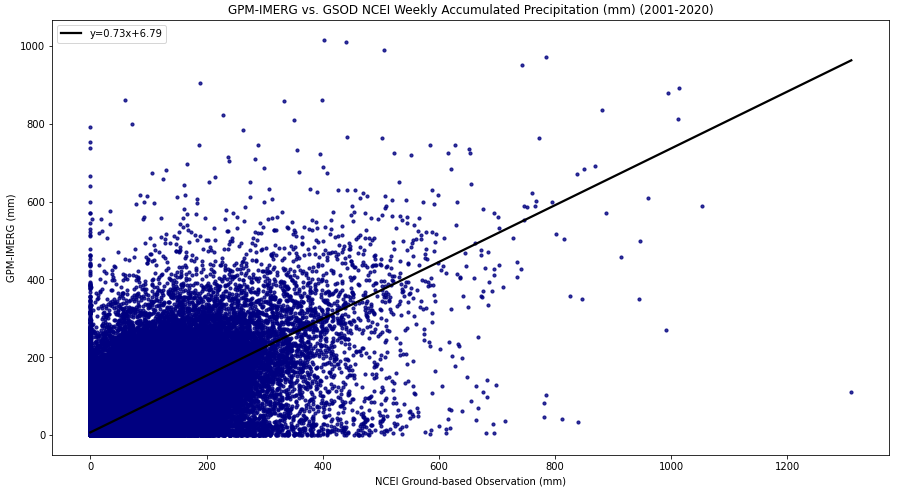
The POWER project compared accumulated precipitation from the National Oceanic and Atmospheric Administration (NOAA) National Centers for Environmental Information (NCEI) Global Surface Summary of the Day (GSOD) Ground Observation to two precipitation sources: the Integrated Multi-satellitE Retrievals for GPM (IMERG) and MERRA-2. This comparison was done to evaluate the performance between the higher resolution IMERG against the MERRA-2 data product.
Two test cases were completed to conduct this comparison:
- All Events: pairs compared at the weekly and monthly level.
- Precipitation Only: pairs compared at the weekly and monthly level where precipitation was greater than zero.
The IMERG data is only available at the daily temporal in UTC time for POWER's services.
Data Integration
The GSOD, IMERG, and MERRA-2 data were integrated into weekly and monthly accumulations based on the following steps and criteria:
- Cleaned the year-based GSOD site files by checking the quality codes, removing fill values, and aggregating the data into one site-based file.
- Joined the IMERG and MERRA-2 based data to each GSOD site-based file.
- Integrated site-based files by first requiring five days of data, across all three sources, before summing into a weekly accumulated value.
- From the weekly integrated site-based files by first requiring three weeks of data, across all three sources, before summing into a monthly accumulated value.
All Events
The Summary of Statistics below is associated with density scatter plots for all the data integration pairs.
| Accumulated | Bias | σ | RMSE | CC | Slope | Intercept | Rsqrd |
|---|---|---|---|---|---|---|---|
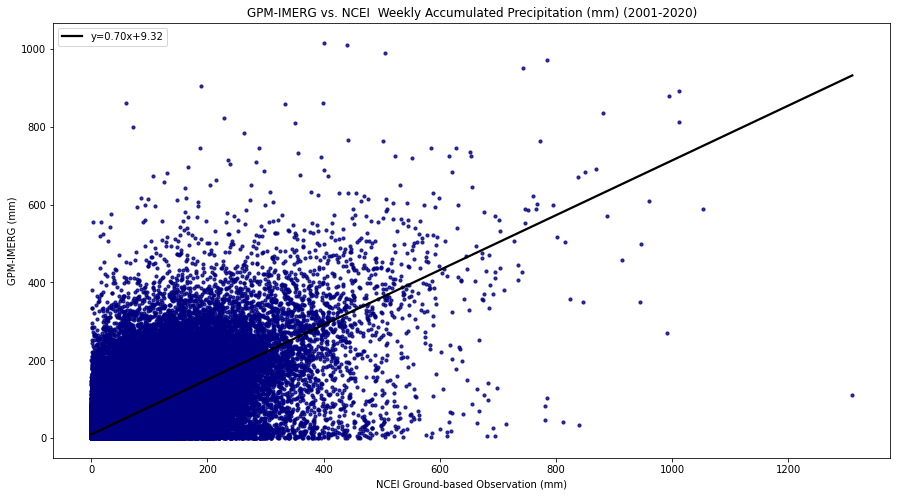
| IMERG Weekly | 2.79 | 24.10 | 24.26 | 0.72 | 0.73 | 6.79 | 0.51 |
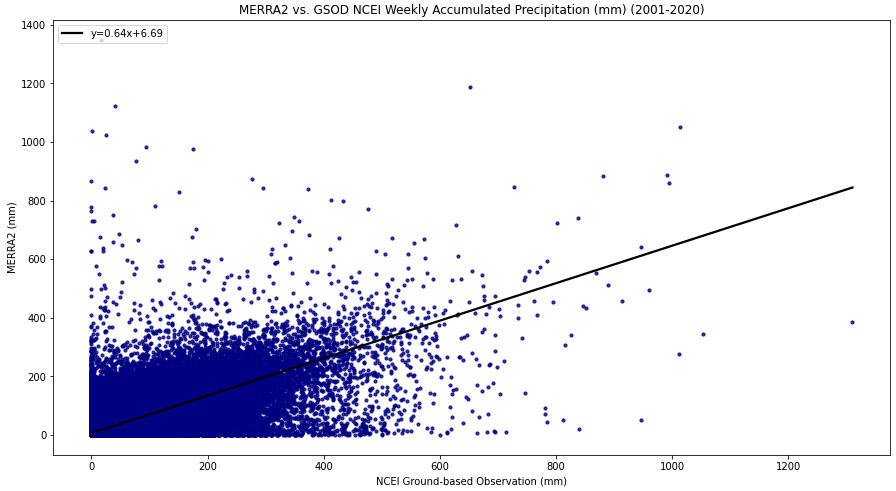
| MERRA-2 Weekly | 1.35 | 20.64 | 20.69 | 0.76 | 0.64 | 6.69 | 0.58 |
IMERG - Weekly - All Events
MERRA-2 - Weekly - All Events
| Accumulated | Bias | σ | RMSE | CC | Slope | Intercept | Rsqrd |
|---|---|---|---|---|---|---|---|
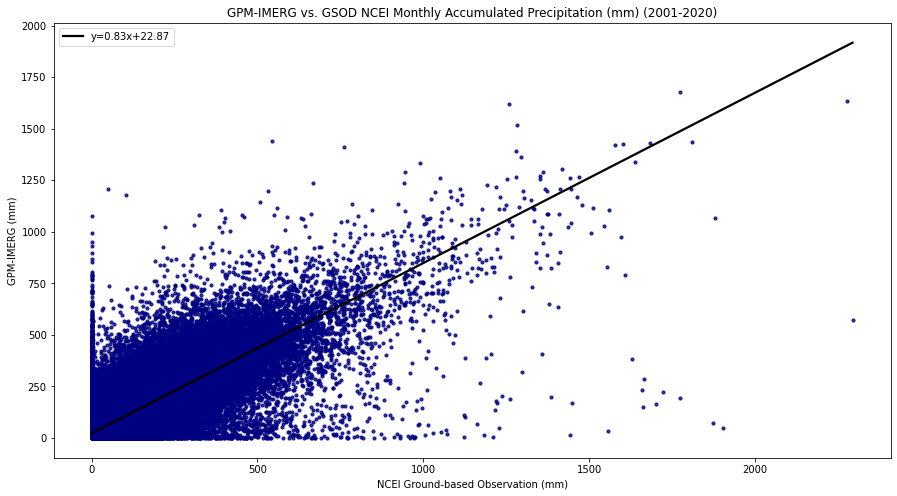
| IMERG Monthly | 11.63 | 58.36 | 59.51 | 0.83 | 0.83 | 22.87 | 0.68 |
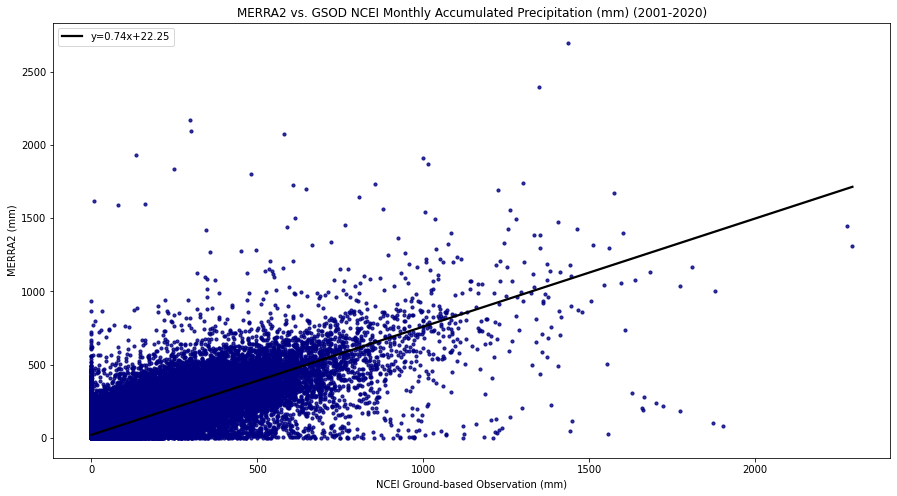
| MERRA-2 Monthly | 5.31 | 55.48 | 55.74 | 0.83 | 0.74 | 22.25 | 0.69 |
IMERG - Monthly - All Events
MERRA-2 - Monthly - All Events
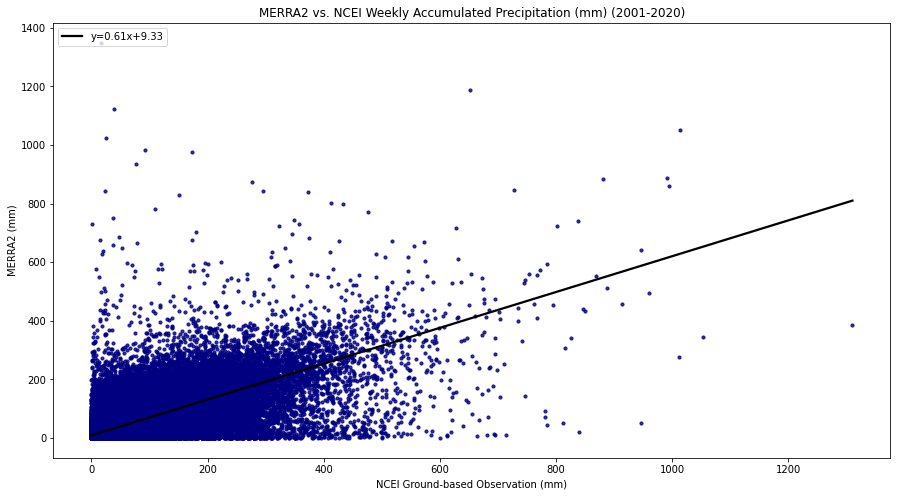
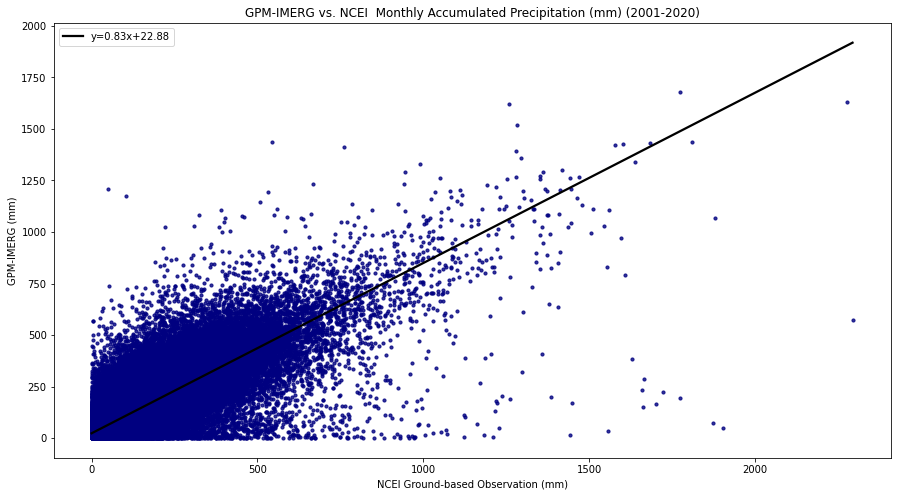
Precipitation Only
The Summary of Statistics below is associated with density scatter plots, where the data integration pairs for IMERG or MERRA-2 and the GSOD Ground Observation are both greater than zero.
| Accumulated | Bias | σ | RMSE | CC | Slope | Intercept | Rsqrd |
|---|---|---|---|---|---|---|---|
| IMERG Weekly | 2.09 | 28.92 | 29.00 | 0.71 | 0.70 | 9.32 | 0.50 |
| MERRA-2 Weekly | -0.18 | 24.87 | 24.87 | 0.76 | 0.61 | 9.33 | 0.57 |
IMERG - Weekly - Precipitation Only
MERRA-2 - Weekly - Precipitation Only
| Accumulated | Bias | σ | RMSE | CC | Slope | Intercept | Rsqrd |
|---|---|---|---|---|---|---|---|
| IMERG Monthly | 8.79 | 59.25 | 59.90 | 0.84 | 0.83 | 22.88 | 0.70 |
| MERRA-2 Monthly | 1.31 | 57.31 | 57.32 | 0.84 | 0.74 | 22.77 | 0.70 |
IMERG - Monthly - Precipitation Only
MERRA-2 - Monthly - Precipitation Only
