Dry Bulb Temperature
This section compares MERRA-2 2-meter air temperature to observations reported to the National Center for Environmental Information (NCEI – formerly National Climatic Data Center). Selected surface sites from the NCEI Integrated Surface Database (ISD) files are used for the hourly MERRA-2 comparisons. Global "Summary of the Day" (GSOD) files are used for the comparison to the daily mean MERRA-2 temperature.
Hourly
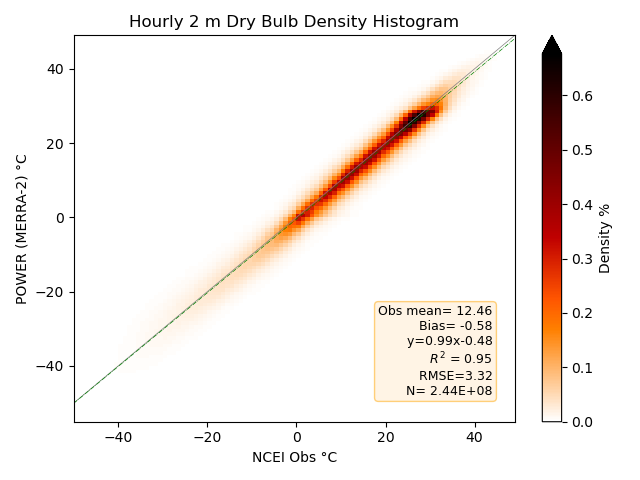
Hourly Dry Bulb Temperature
Density plot of the 2-D histograms comparing MERRA-2 hourly temperatures with station observations from the selected NCEI ISD files for the years 2001–2020. Darker reds indicate a higher number of matched pairs within the 2-D histogram.
Daily Average
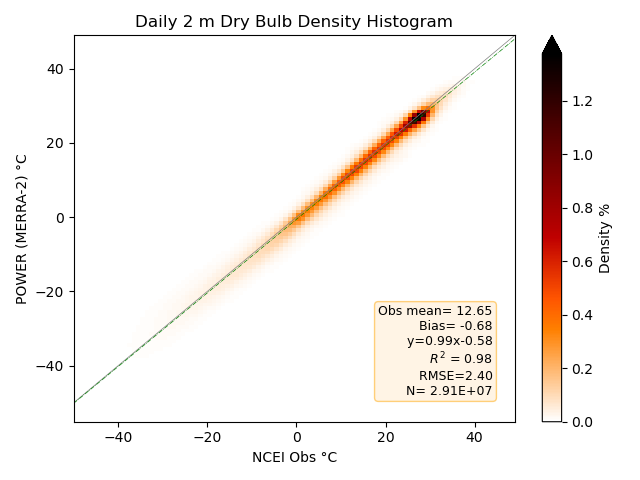
Daily Average Dry Bulb Temperature
Density plot of the 2-D histograms comparing MERRA-2 daily averaged temperatures with station observations from the NCEI GSOD files for 1981–2020. Darker reds indicate a higher number of matched pairs within the 2-D histogram.
Daily Maximum
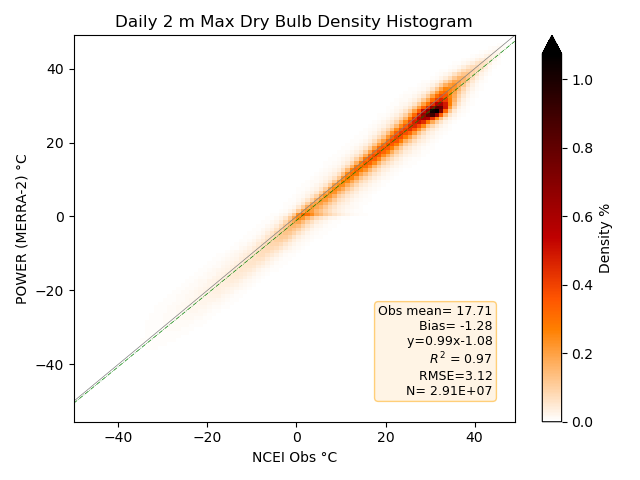
Daily Maximum Dry Bulb Temperature
Density plot of the 2-D histograms comparing MERRA-2 daily maximum temperatures with station observations from the NCEI GSOD files for 1981–2020. Darker reds indicate a higher number of matched pairs within the 2-D histogram.
Daily Minimum
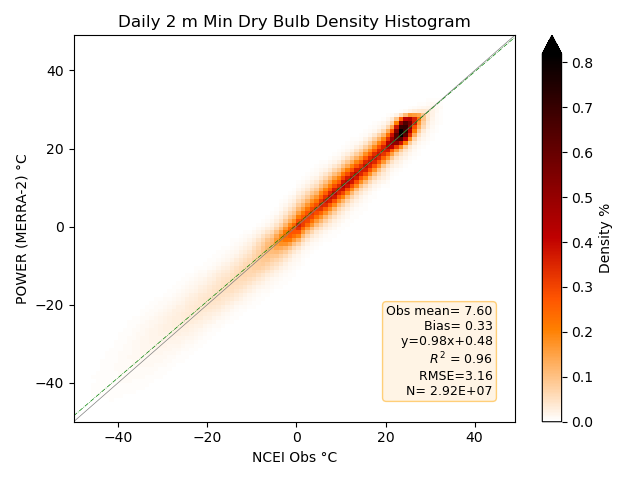
Daily Minimum Dry Bulb Temperature
Density plot of the 2-D histograms comparing MERRA-2 daily minimum temperatures with station observations from the NCEI GSOD files for 1981–2020. Darker reds indicate a higher number of matched pairs within the 2-D histogram.
Plot Notes
- The legend on each density plot gives the site observation mean, bias with MERRA-2, root mean squared error (RMSE), equation of the line for the linear least squares fit, coefficient of determination, and number of data pairs to the plotted values.
- The color bar along the right side of the density plot provides a measure of the frequency of the data pairs per bin in plot.