Heating/Cooling Degree Days
An important application of historical temperature data is in the evaluation of Heating Degree Days (HDD) and Cooling Degree Days (CDD). The HDD and CDD are based upon the deviation of the daily averaged temperature, typically evaluated as (T_{max} + T_{min})/2, relative to a reference temperature, T_{base}. The following expressions are used herein for calculating HDD and CDD (Chapter 14 of ASHRAE, 2013):
\begin{align} T_{i} = (T_{max} + T_{min})/2 \tag {Equation 1} \end{align}
\begin{align} HDD = \sum(T_{base} - T_i )^+ \tag {Equation 2} \end{align}
\begin{align} CDD = \sum( T_i - T_{base})^+ \tag {Equation 3} \end{align}
The "+" superscript in the above equations indicates that only the positive values of the operation in the parenthesis are taken into account in the sum. The sum is taken from i = 1 to N, where N is number of days in the given time period. POWER provides HDD and CDD values for T_{base} = 0 °C, 10 °C, and 18.3 °C.
Validation
HDD
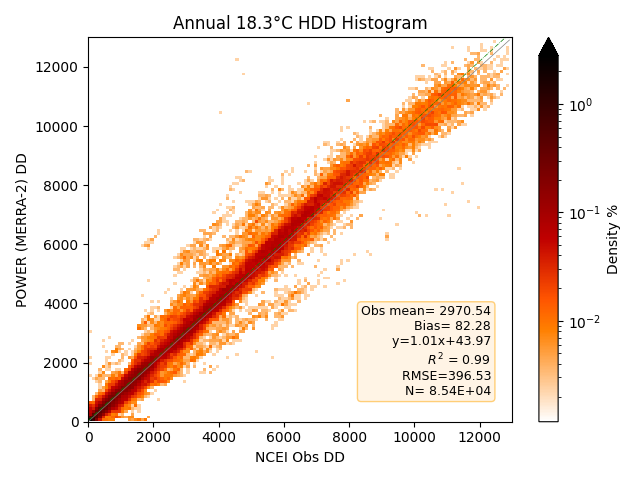
Density plot of the 2-D histograms comparing the calculated heating degree days from MERRA-2 with those calculated from station observations from the NCEI GSOD files for 1981–2023. Darker reds indicate a higher number of matched pairs within the 2-D histogram. Note that the color scale is logarithmic to show more bins, as the densest bins are near the origin.
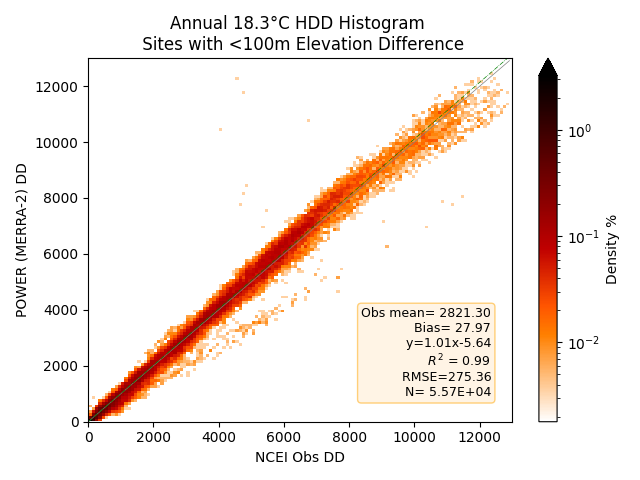
Like the Previous Validation Study (see info box below), this is the histogram for the surface sites with MERRA-2 elevation within 100 m of the station elevation.
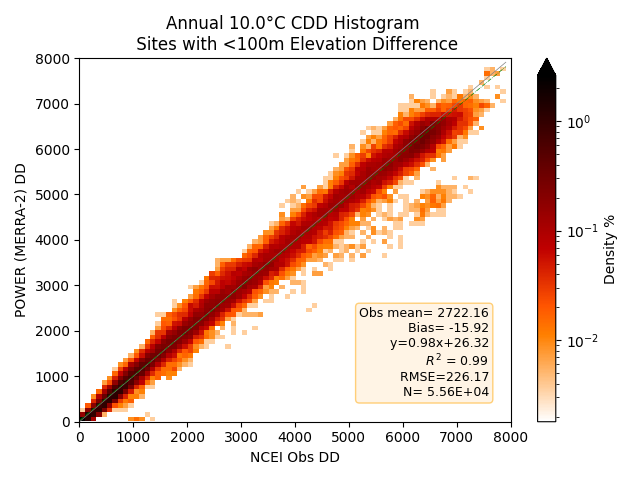
CDD
Density plot of the 2-D histograms comparing the calculated cooling degree days from MERRA-2 with those calculated from station observations from the NCEI GSOD files for 1981–2023. Darker reds indicate a higher number of matched pairs within the 2-D histogram. Note that the color scale is logarithmic to show more bins, as the densest bins are near the origin.
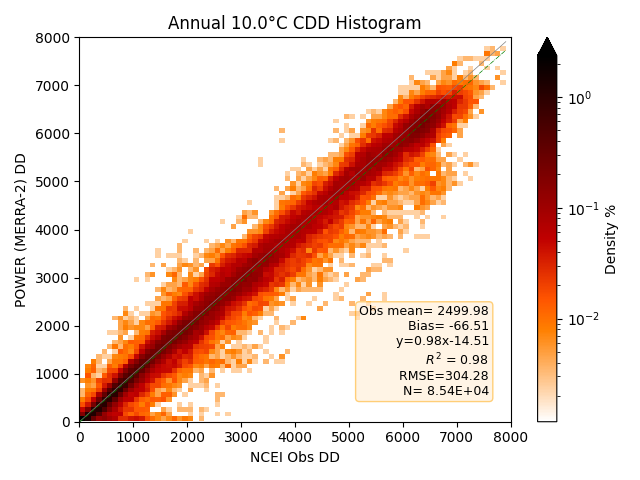
Like the Previous Validation Study (see info box below), this is the histogram for the surface sites with MERRA-2 elevation within 100 m of the station elevation.
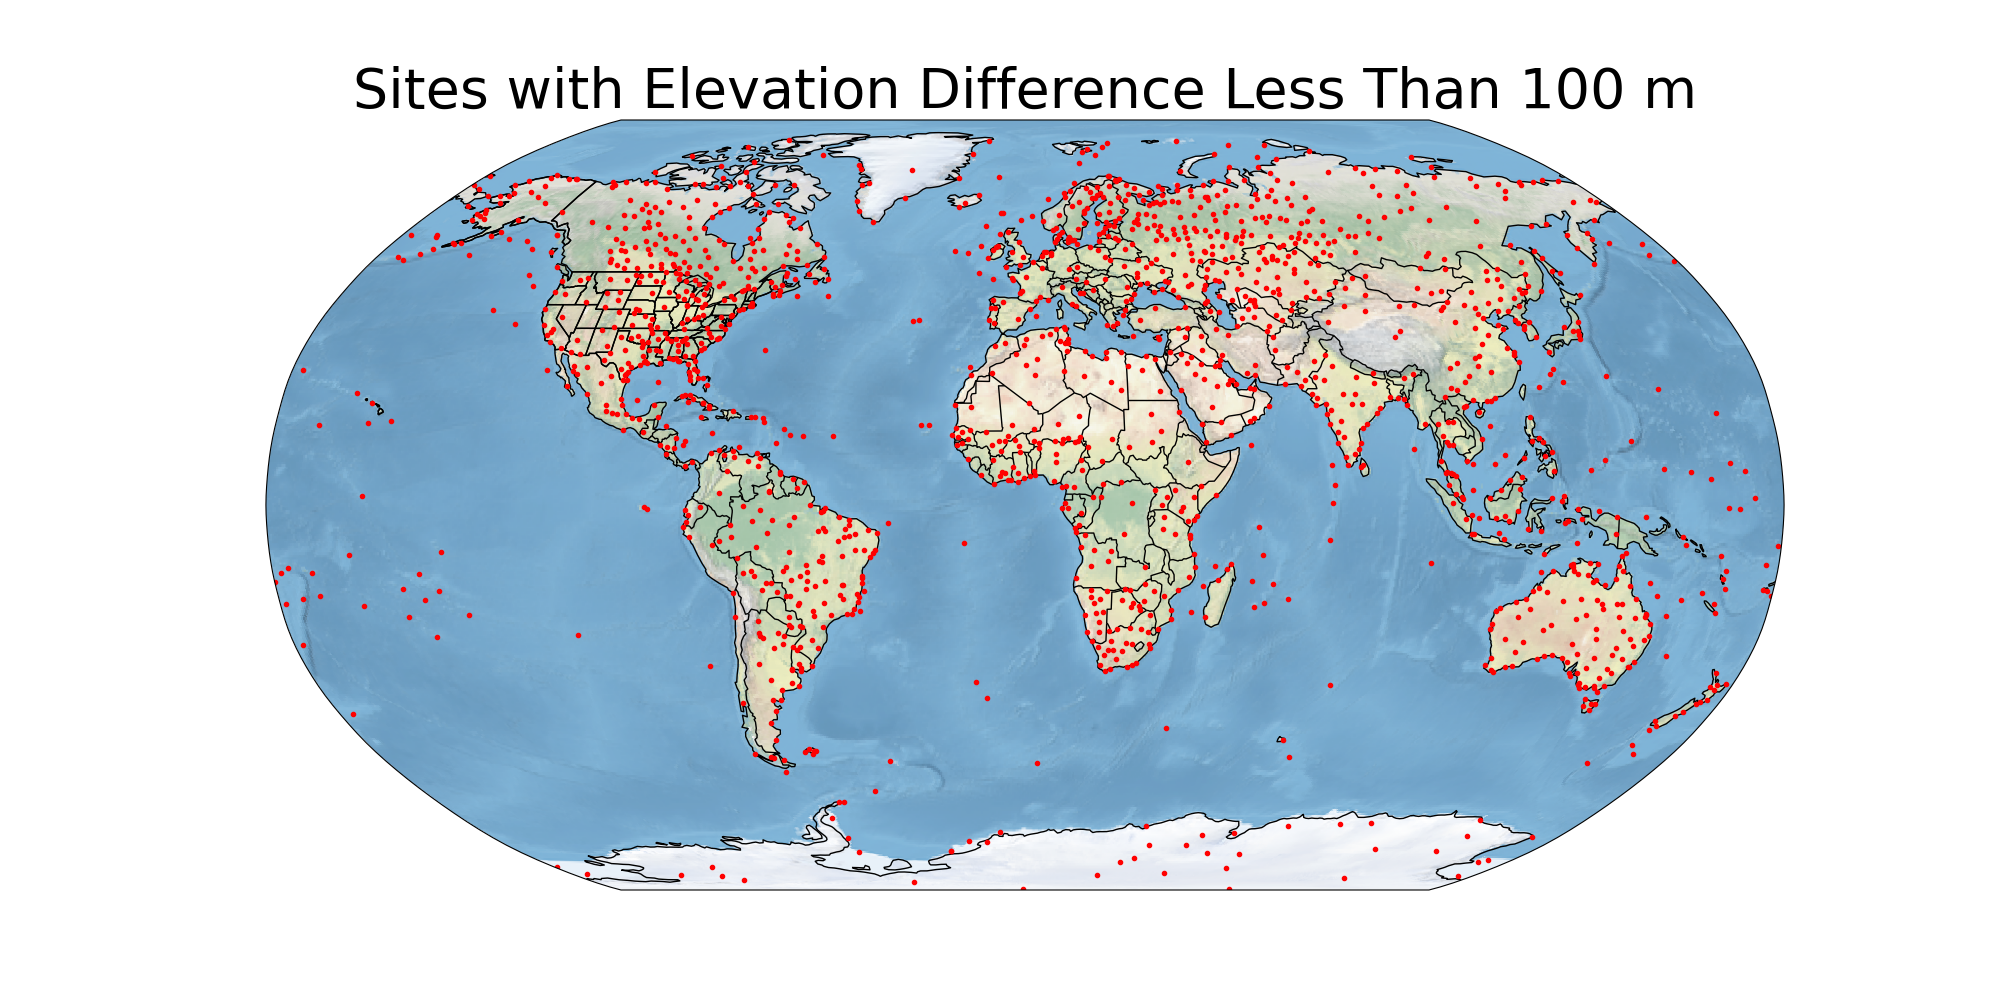
Map of Sites with Elevation Difference Less Than 100 m
Previous Validation Study
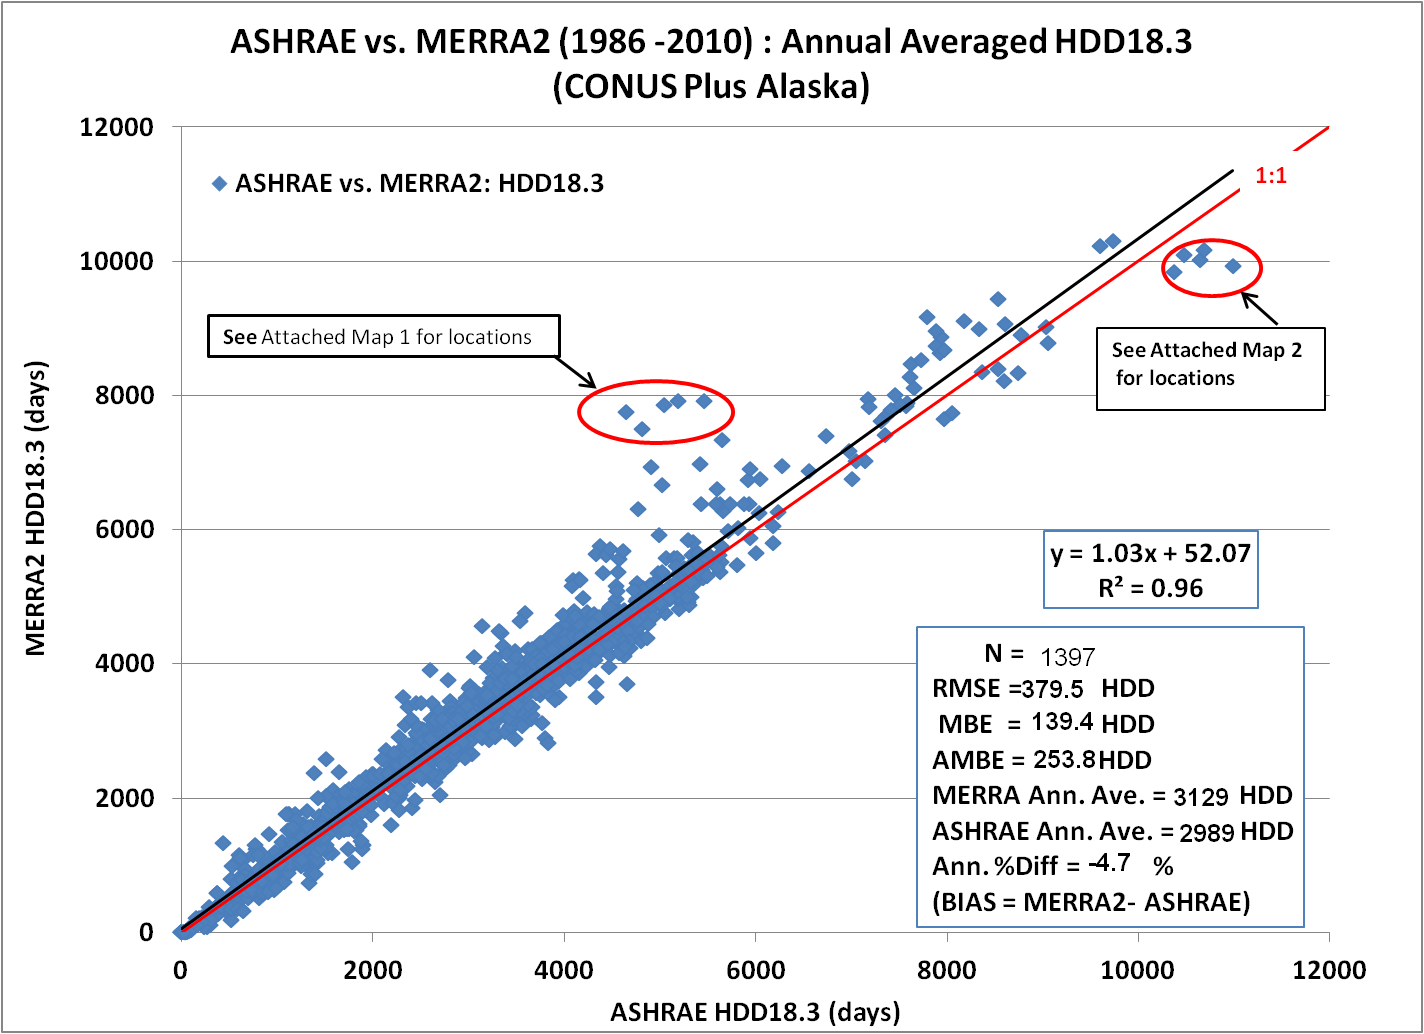
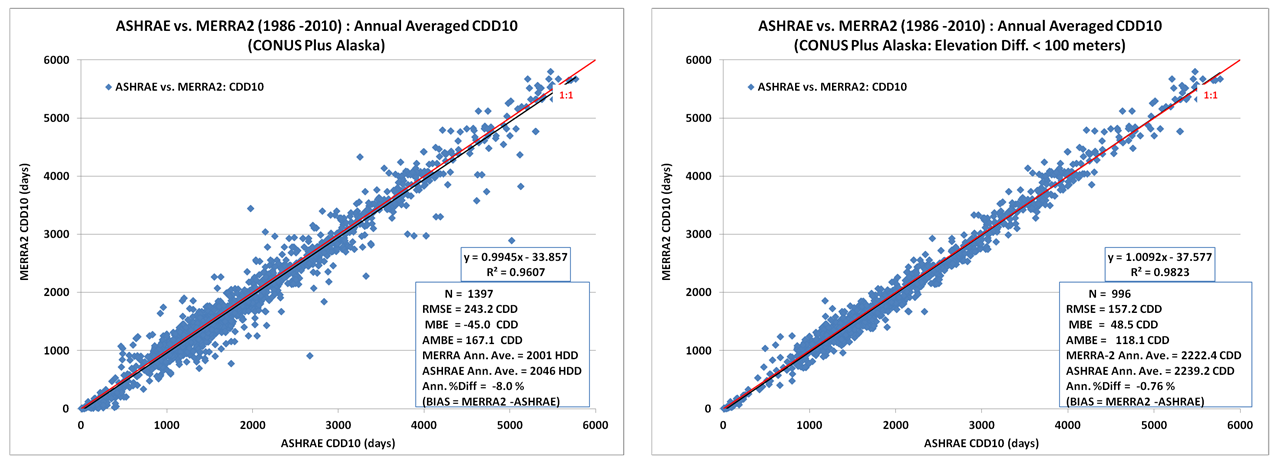
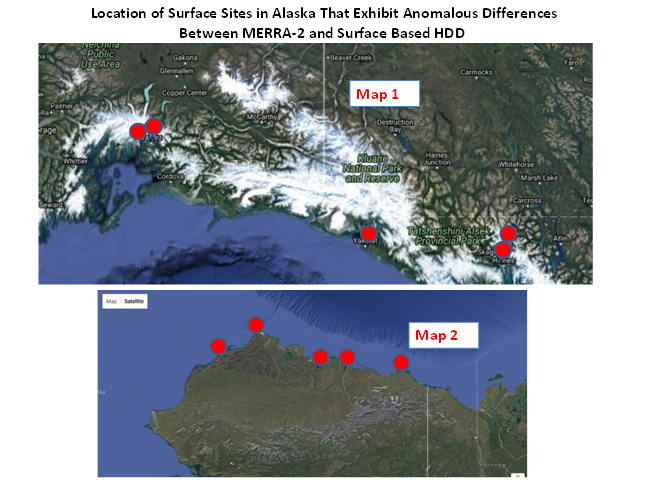
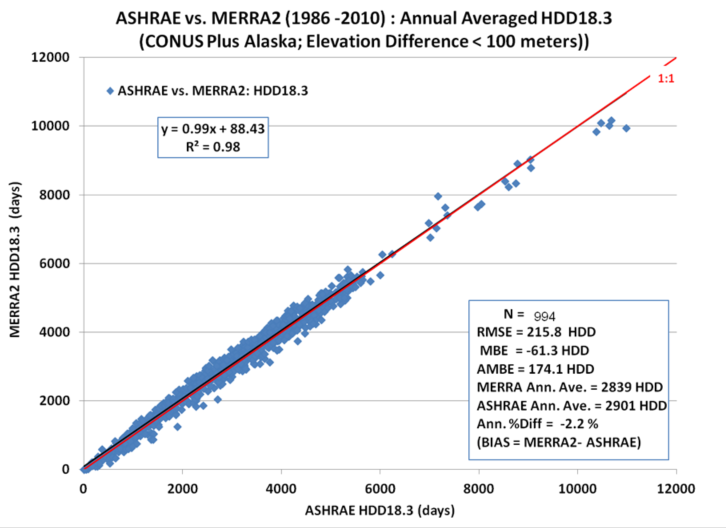
The scatter plot of the HDD T_{base} = 18.3 °C, shown above, calculated via Equation 2 using the MERRA-2 temperatures versus the corresponding HDD values taken from the American Society of Heating, Refrigerating and Air-Conditioning Engineers (ASHRAE) Weather Data Viewer version 5.0 (WDV 5.0). The WDV values are based upon surface observations over the time period 1986–2010; the MERRA-2 values correspond to the temperature for the MERRA-2 0.5° grid cell around the given surface site. The scatter plot above encompasses 1,397 surface grid pairs in the continental US (CONUS) and Alaska. While the overall agreement is good, note the cluster of data point circled in the middle and the upper right portion of the scatter plot. These data are associated with the surface sites shown on maps 1 and 2 below, and are highlighted to call attention to two aspects of the MERRA-2 data that can be problematic depending on the application. Recall that the MERRA-2 values represent the average over their original source spatial resolution. Accordingly, in mountainous regions (e.g., map 1) the average elevation of the MERRA-2 cell can be significantly different from the elevation of the local surface site. Similarly, in regions where the surface temperatures may have strong horizontal gradients, such as near coast lines (e.g., map 2) the average temperature of the MERRA-2 cell can be different than the local station.
The scatter plot and associated statistics for the same stations used when the elevation difference between the surface site and the MERRA-2 grid is less than 100 m.
The left and right scatter plots below show the corresponding scatter plots for CDD with T_{base} = 10 °C.