Meteorological Data Assessment Process
The assessment of the accuracy of the MERRA-2 parameters is based upon comparisons with observations from the corresponding parameters reported to the National Center for Environmental Information (NCEI). Hourly assessments are compared against the Integrated Surface Database (ISD), while daily average assessments are compared against the Global Summary of the Day (GSOD).
In the following sections, scatter plots associated with each meteorological parameter provide a visual indication of the agreement between the MERRA-2 values and surface observations. The statistical parameters enumerated on each scatter plot and summarized in tables gives a more quantitative assessment of this agreement. These statistics between the model estimates and surface observations include the slope, intercept, and Pearson correlation coefficient associated with a linear least squares regression fit, the Mean Bias Error (MBE), and Root Mean Square Error (RMSE).
Hourly Assessment
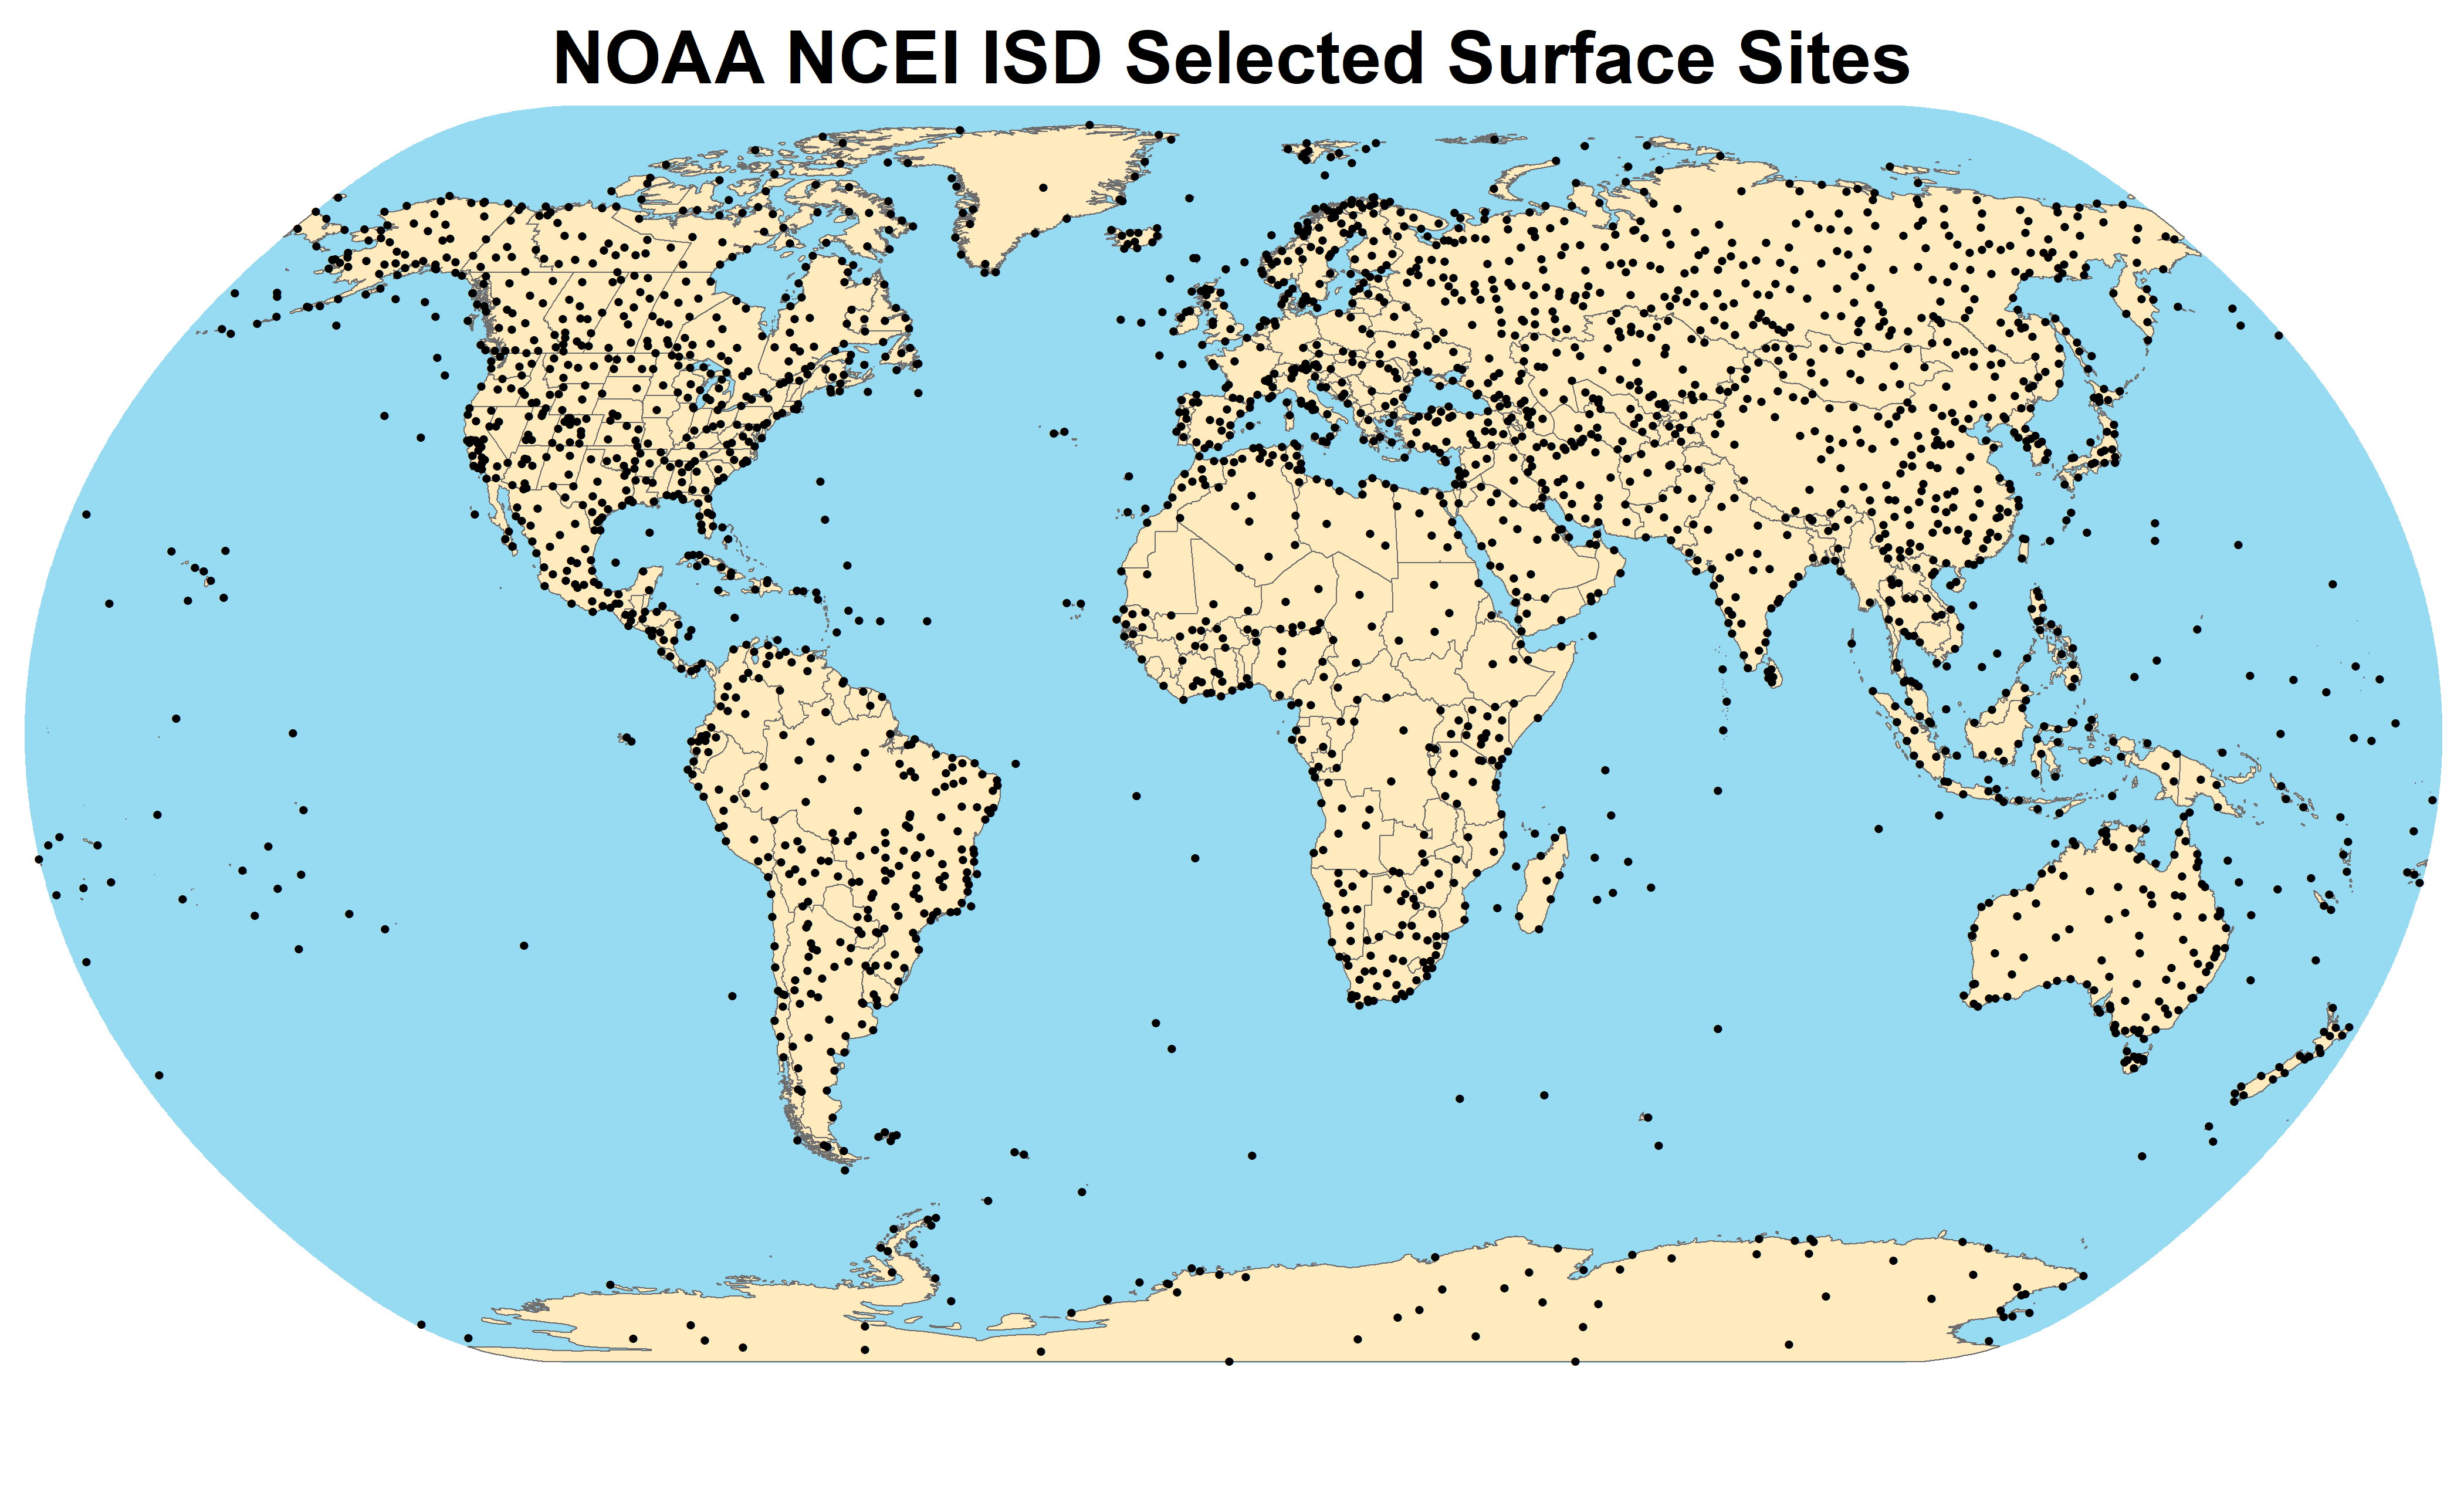
The assessment of the accuracy of the hourly MERRA-2 parameters is based upon the surface observations reported in the NCEI Integrated Surface Database (ISD). After applying quality control codes available with the database to the data, only the reports closest to the top of the hour are retained for potential validation. The next qualification is that there must be a minimum of 2,200 hourly reports in any given year (about 25%) for a site year to be considered. Surface sites are then selected within half-degree grid boxes for each available surface type, (18 total, including forests, shrublands, grass and crop lands, permanent snow or ice, etc.) while also having as much data as possible. This selection process allows for a greater number of surface sites in Africa, South America, Asia, and Eastern Europe to compare against MERRA-2. The years of interest for hourly validation are from 2001–2020.
NCEI ISD Surface Stations
Hourly Surface Validation Summary
Presented here are the results of comparing the original MERRA-2 hourly meteorological parameters to corresponding surface observations from 2,599 stations reported in the NOAA/NCEI Integrated Surface Data files. The Slope, Intercept, and R-squared (Rsqrd) listed in this table are associated with a linear least squares fit of hourly observations at each surface station to the corresponding MERRA-2 values for the overlapping grid cell for 2001–2020. The Mean Bias Error (MBE), Mean Absolute Error (MAE), and Root Mean Square Error (RMSE) represent mean values over the comparison years.
| Parameter | MBE | MAE | RMSE | Slope | Intercept | Rsqrd |
|---|---|---|---|---|---|---|
| Temperature (°C) | -0.58 | 2.40 | 3.32 | 0.99 | -0.48 | 0.96 |
| Dew Point Temperature (°C) | 0.00 | 2.42 | 3.54 | 0.92 | 0.51 | 0.93 |
| Precipitation (mm) | 0.00 | 0.16 | 1.24 | 0.08 | 0.11 | 0.06 |
| Elevation Corrected Surface Pressure (hPa) | 0.26 | 1.14 | 2.11 | 0.98 | 15.33 | 1.00 |
| Wind Speed (m/s) | 0.52 | 1.82 | 2.47 | 0.54 | 2.14 | 0.40 |
- The parameters are evaluated at the hourly temporal level.
- The height above the surface over the entire grid box area is 2 m for each parameter, except for the wind which is 10 m.
Daily Average Assessment
Comparison statistics for the daily assessment are based upon comparisons of the given parameter for 1981–2020. The same set of sites from the hourly assessment are used here.
Daily Average Surface Validation Summary
Presented here are the results of comparing MERRA-2 daily meteorological parameters to corresponding surface observation reported in the National Center for Environmental Information (NCEI) (formerly National Climatic Data Center) Global Summary of the Day (GSOD) files. The Slope, Intercept, and R-squared (Rsqrd) listed in this table are associated with a linear least squares fit of daily observations at each surface station to the corresponding MERRA-2 values for the overlapping grid cell. The Mean Bias Error (MBE) and Root Mean Square Error (RMSE) represent mean values over the comparison years.
| Parameter | MBE | RMSE | Slope | Intercept | Rsqrd |
|---|---|---|---|---|---|
| Average Temperature (°C) | -0.53 | 2.10 | 1.00 | -0.58 | 0.97 |
| Minimum Temperature (°C) | 0.32 | 3.15 | 0.98 | 0.46 | 0.87 |
| Maximum Temperature (°C) | -1.23 | 3.10 | 0.99 | -1.01 | 0.87 |
| Dew Point Temperature (°C) | 0.21 | 2.34 | 0.95 | 0.51 | 0.95 |
| Precipitation (mm/day) | 0.55 | 3.69 | 0.64 | 1.05 | 0.39 |
| Elevation Corrected Surface Pressure (hPa) | 0.30 | 1.82 | 0.98 | 16.73 | 0.72 |
| Wind Speed (m/s) | 0.33 | 1.45 | 0.79 | 1.09 | 0.60 |
- The height above the surface over the entire grid box area is 2 m for each parameter, except for the wind which is 10 m.