Solar Irradiance Data Sets Changes and Updates (Bias Correction of SRB Data)
POWER provides irradiance data sets that are derived from NASA's Global Energy and Water Cycle Experiment Surface Radiation Budget (GEWEX SRB) Project Release 4-Integrated Product (R4-IP) archive (Stackhouse et al., 2021) and NASA's Clouds and the Earth's Radiant Energy System (CERES) SYN1deg. The POWER data sets concurrently concatenate these data sets.
Solar Irradiance Source and Availability
| Source | Temporal Coverage Start | Temporal Coverage End |
|---|---|---|
| GEWEX SRB R4-IP | January 1, 1984 | December 31, 2000 |
| CERES SYN1deg Ed.4.1 | January 1, 2001 | NRT minus ~3–4 months |
A systematic bias was reported between these two data sets while they were merged together in the year 2001. These biased solar irradiance data can have serious implication to those communities who use this data for the applications such as solar energy system design, agricultural planning, and climate modeling. For obtaining a consistent climate data record spanning the entire time record of observations, a bias correction method (Quantile Mapping) was implemented to remove the bias. For each 1° latitude by 1° longitude grid box across the globe, the algorithm matches the Cumulative Distribution Function’s (CDF) of the reference data set (CERES SYN1deg) to that of the SRB data set, thereby, adjusting the irradiance values to match the empirical distribution of two different measurements. The CDF represents the probability that a given value will be less than or equal to specific threshold. The CERES SYN1deg and SRB irradiance have overlapping daily data from the time period 2001 to 2009 and this overlapping data set is used for training bias correction model.
The bias corrected solar irradiances has improved accuracy and reliability especially for the weather conditions associated with high cloud cover and extreme values. The all-sky surface longwave downward irradiance, all-sky surface shortwave downward irradiance, clear-sky surface shortwave downward irradiance and clear-sky surface longwave downward irradiance for the time period before 2001 has been adjusted for the POWER V10 Data.
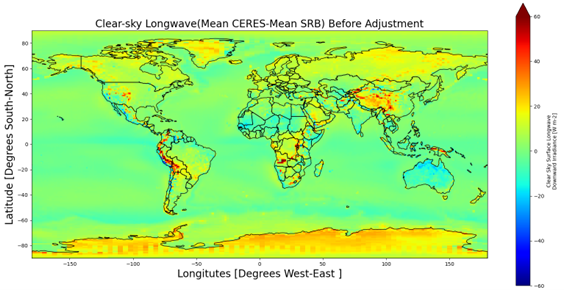
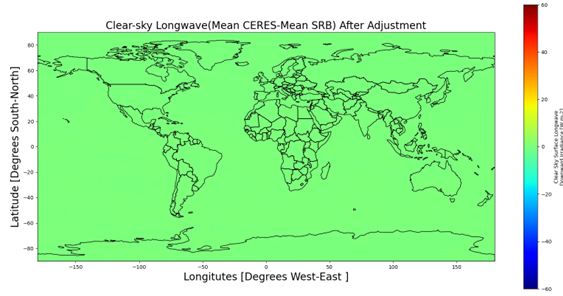
Example: The plot shown in Figure 1 shows the mean difference between the CERES and SRB clear-sky longwave irradiance for overlapping time period. Though the data set exhibits a systematic bias globally the magnitude of differences between SRB and SYN1deg vary across each grid box. The global map after the correction is shown in Figure 2, where the bias has been significantly eliminated. Using the same trained model, the SRB data are adjusted before the year 2001 (i.e., 1984–2001).
Global maps of mean difference between SYN1deg and SRB before and after bias correction for Clear-Sky Longwave
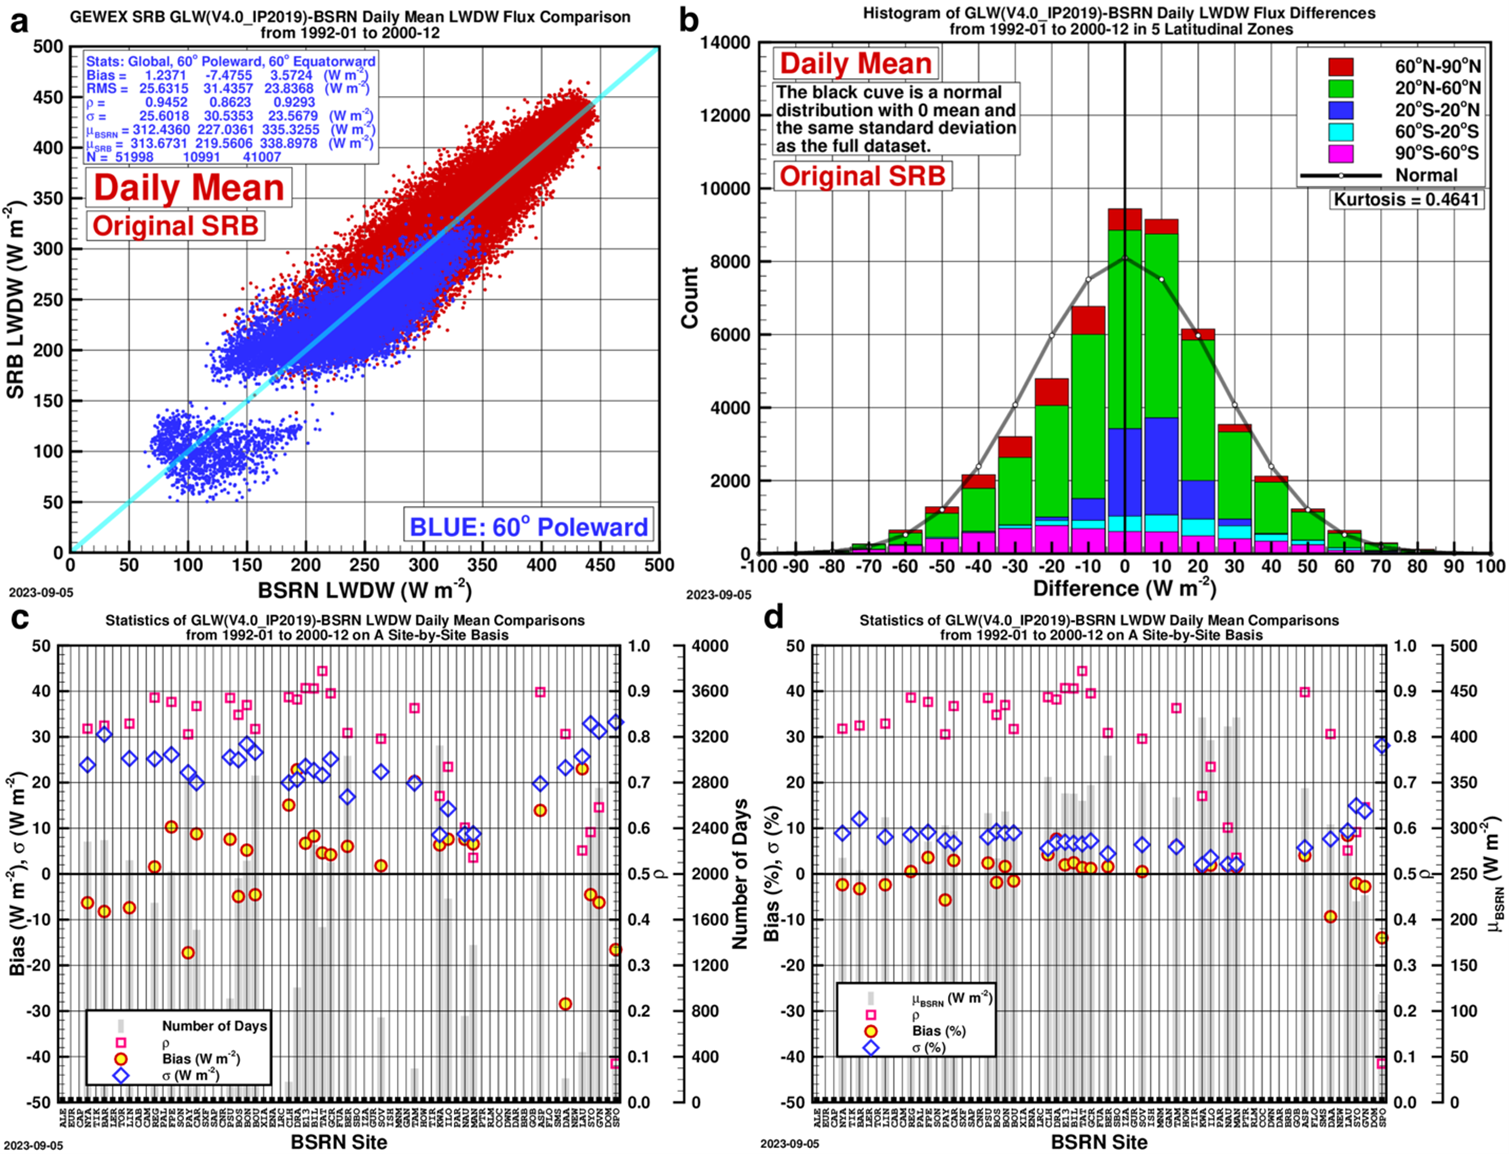
Validation
To see how the quantile mapping adjustment changes the SRB data, the original and adjusted data are compared with the BSRN data. Figures 3 and 4 show the comparison of the SRB daily mean longwave irradiances with their BSRN counterparts before and after the quantile mapping adjustment from 1992 to 2000. The statistics show that the adjusted data agree with the BSRN data better in all three categories, namely, “Global”, “60° poleward” and “60° equatorward”, and the best improvement occurs at sites “60° equatorward”, and this is the zone the most site-months of BSRN data were recorded.
Validations of the original and corrected SRB (V4.0-IP) mean longwave downward irradiance from 1992 to 2000.
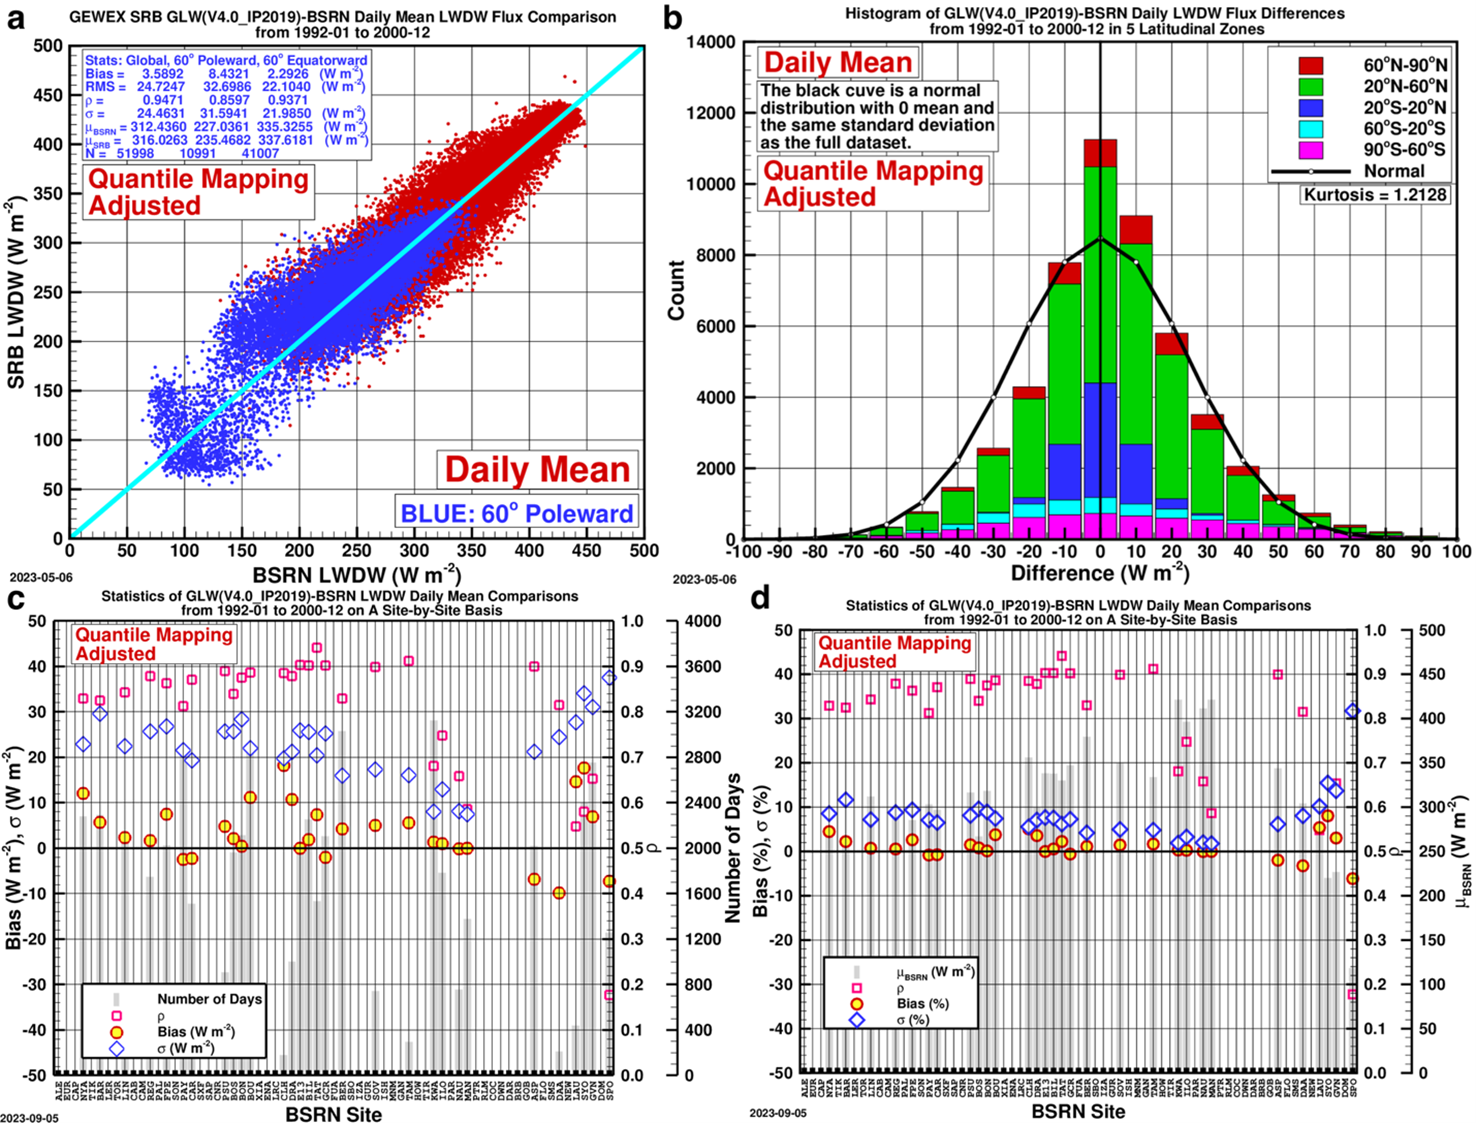
Based on validation efforts that have been carried out for longwave all-sky downward Irradiance and shortwave all-sky downward irradiance (not shown here), it can be concluded that the bias-corrected data agree better with the ground-based BSRN data.