Solar Flux Assessment
The quality of surface-based measurements are generally considered more accurate than satellite-derived values. However, measurement uncertainties from instrument calibration drift, operational uncertainties, instrumental changes, or data gaps are often unknown or unreported for many surface data sets. In 1989, the World Climate Research Program estimated "end-to-end" uncertainties for most routine-operation solar radiation ground sites in the range from 6% to 12%. Specialized high-quality research sites such as those in the Baseline Surface Radiation Network (BSRN) are estimated to be more accurate by a factor of two.
GEWEX SRB 4-IP
Validation of GEWEX SRB 4-IP SW surface downward parameters has been performed by the GEWEX SRB team using land- and ocean-based observations. A summary of this validation at different time scales is presented at GEWEX SRB Validation. While the validation period is longer than the data available through POWER, the statistics obtained are applicable here.
A summary of the daily mean all-sky shortwave (SW) radiative fluxes on a horizontal surface from NASA’s GEWEX SRB Release 4-IP validated against values from BSRN sites is presented below.
| Parameter | Region | Bias (%) | RMSE (%) |
|---|---|---|---|
| Daily Mean SW All-Sky Insolation Jan. 1, 1992–Jun. 30, 2017 | All Sites 60° Poleward 60° Equatorward | 0.7 -3.5 1.0 | 16.6 50.9 14.4 |
| Monthly SW All-Sky Insolation Jan. 1992–Jun. 2017 | All Sites 60° Poleward 60° Equatorward | -5.8 -6.6 -0.2 | 8.6 34.5 6.7 |
Comparison Plots: NASA’s GEWEX SRB Release 4.0 to BSRN Data
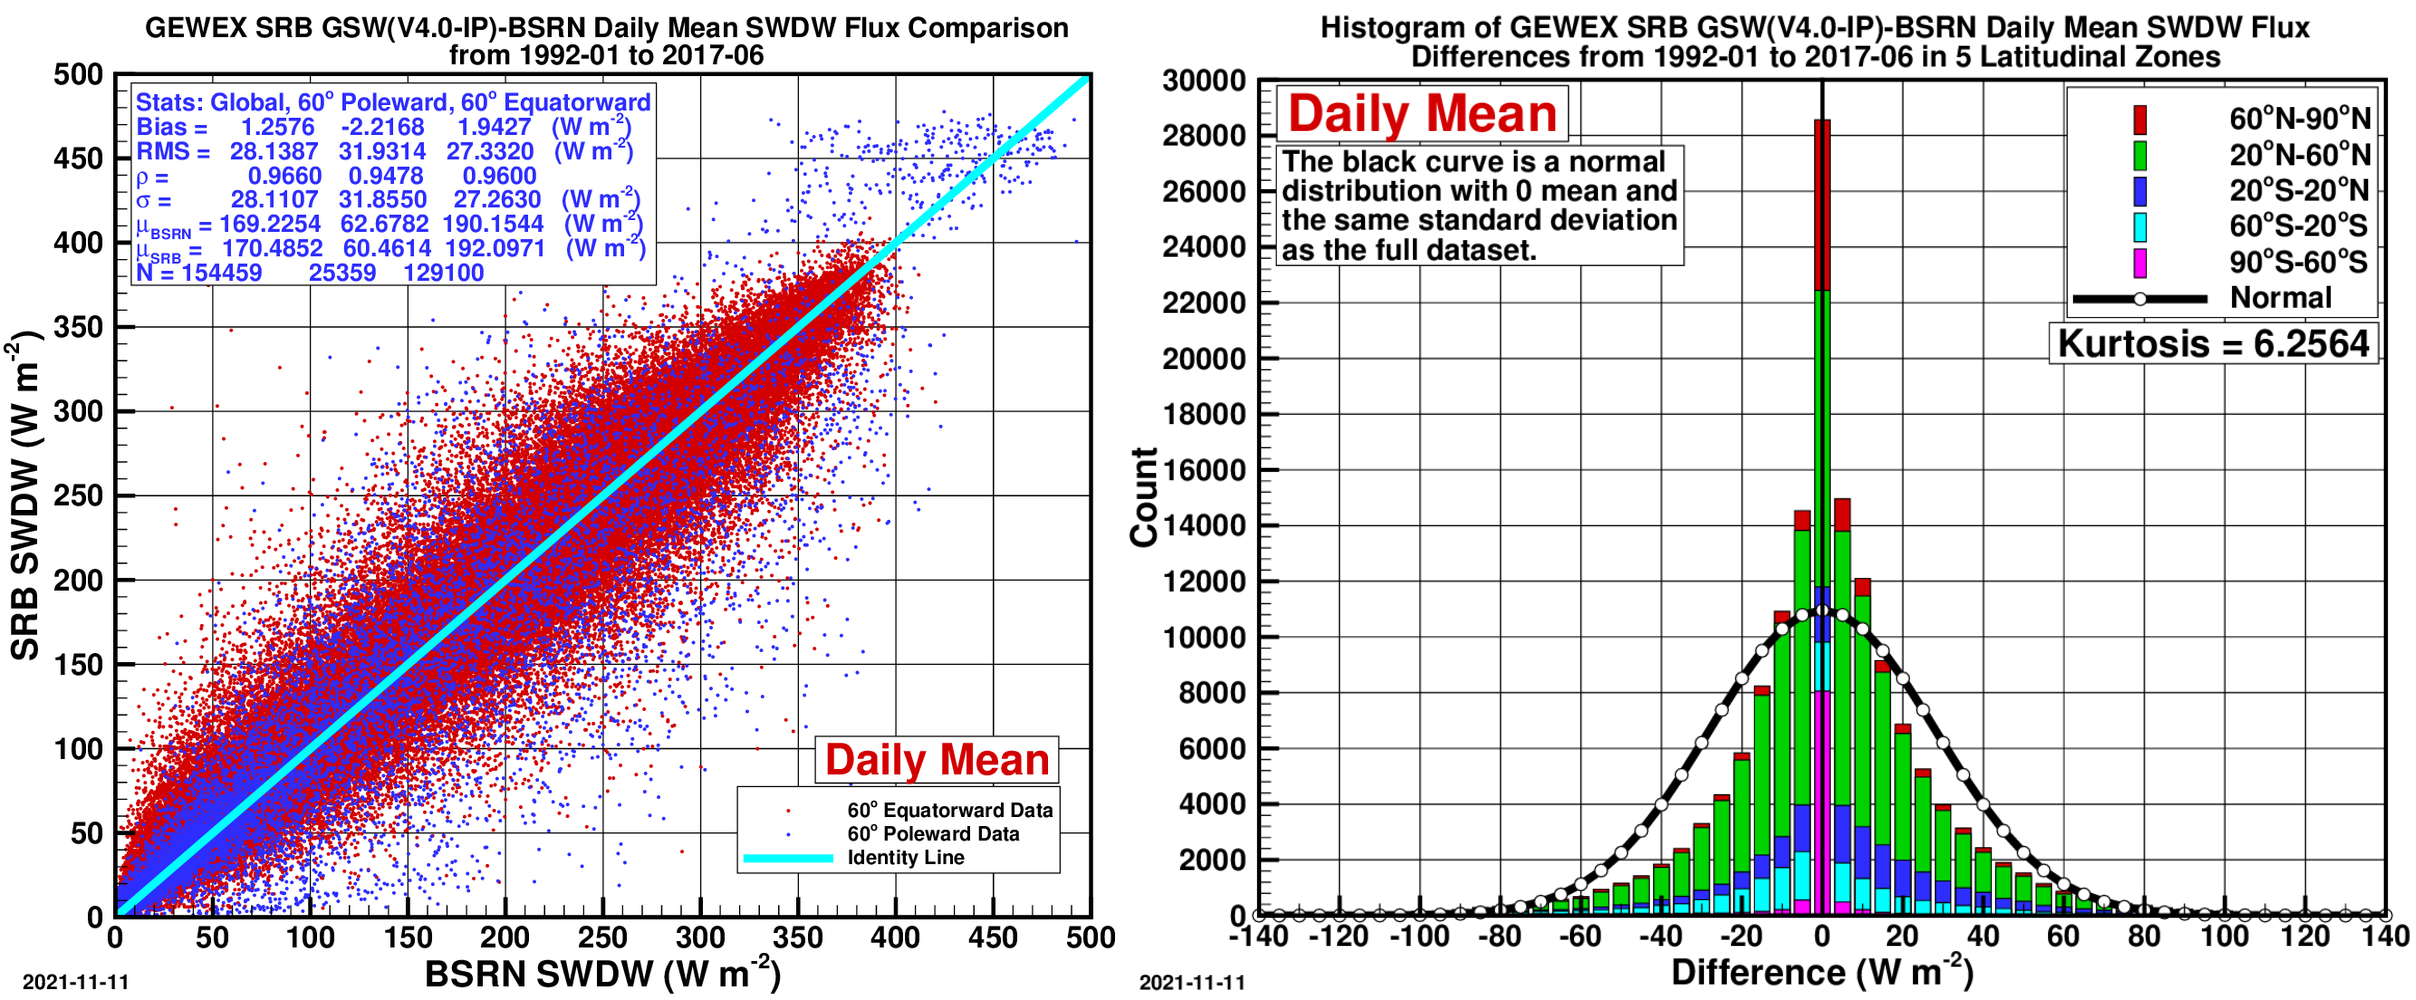
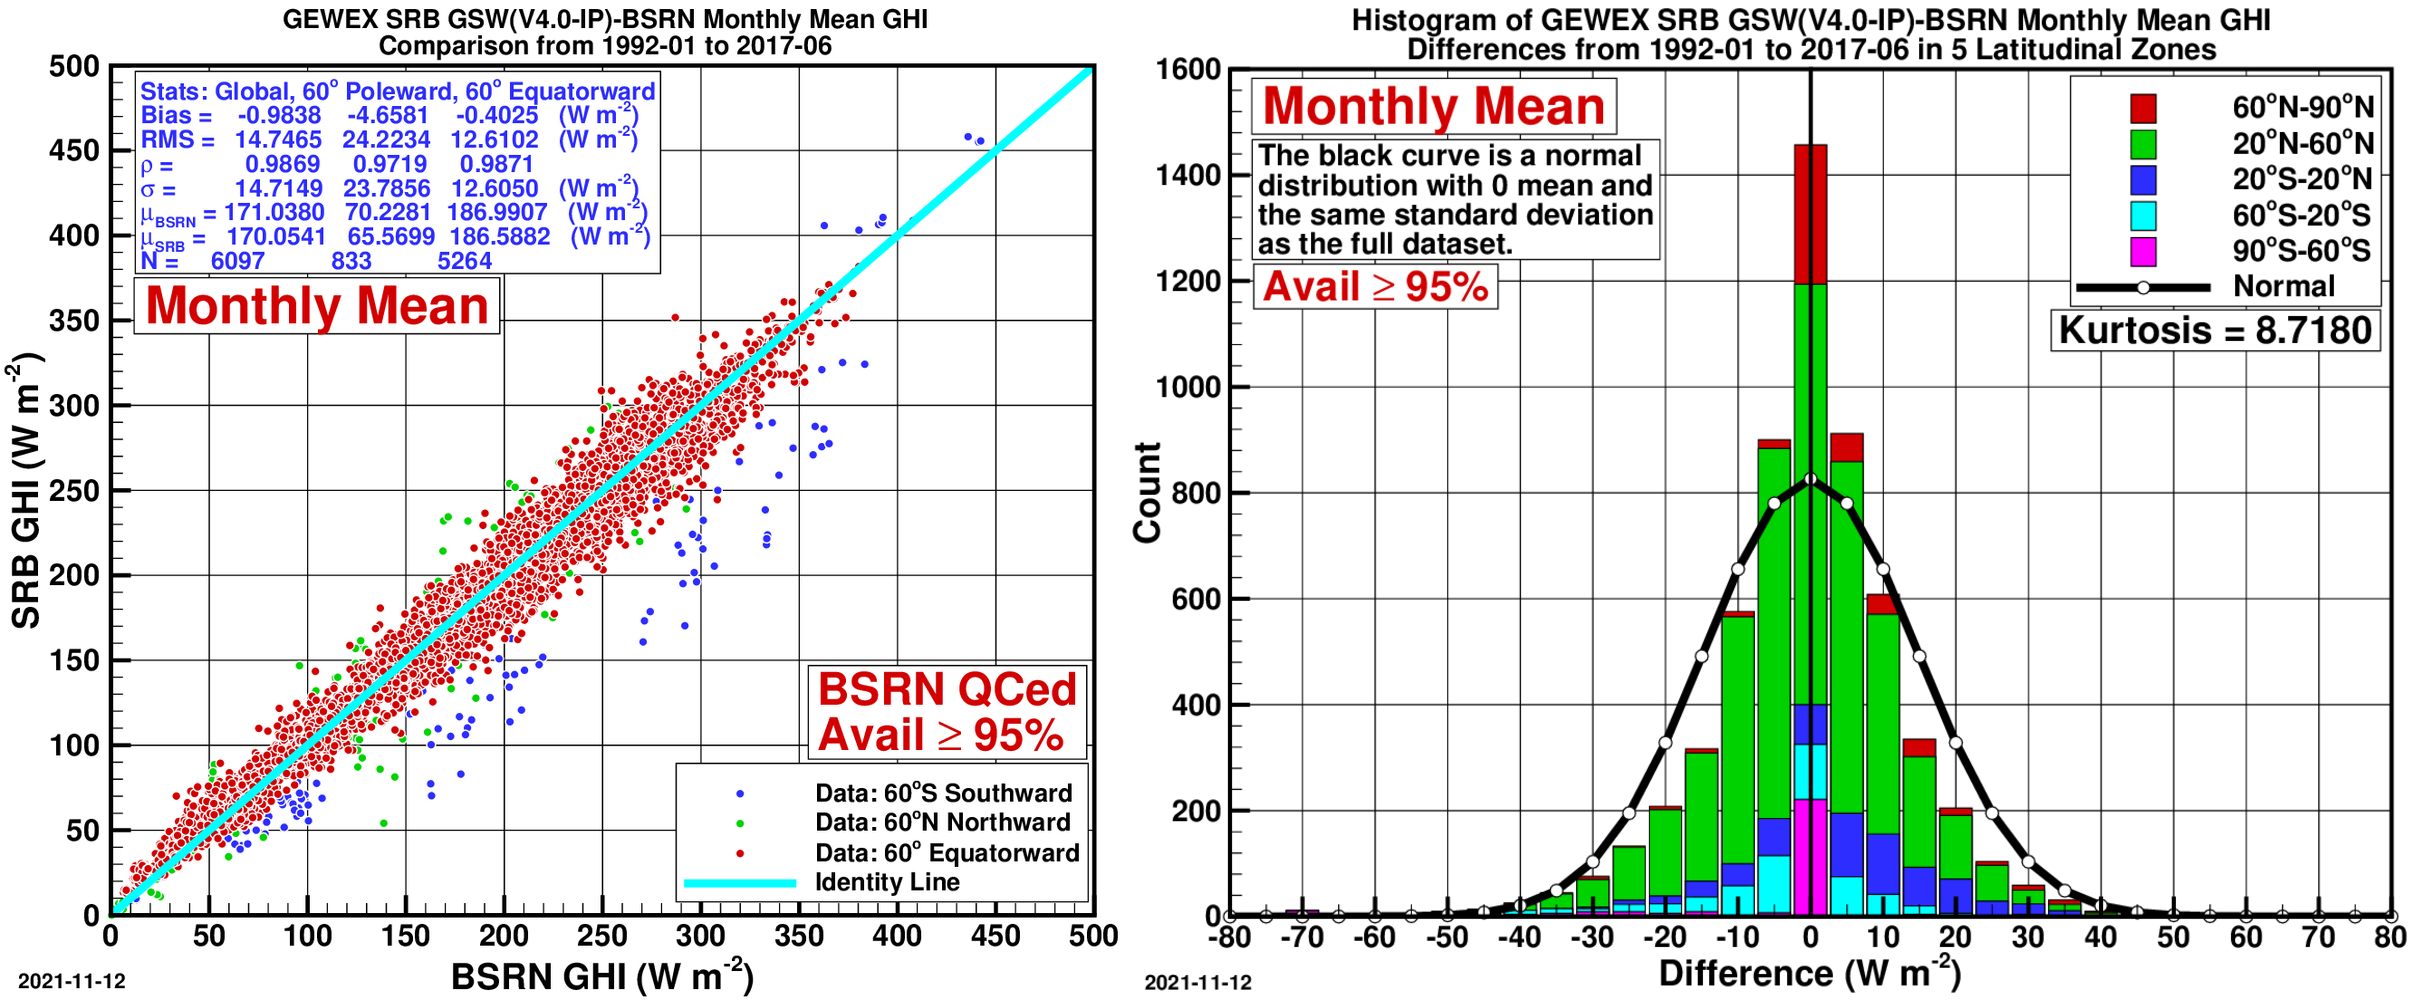
- Left — Scatter Plot of BSRN daily SW insolation vs. GEWEX SRB
- Right — Histogram of Differences:
CERES SYN1deg
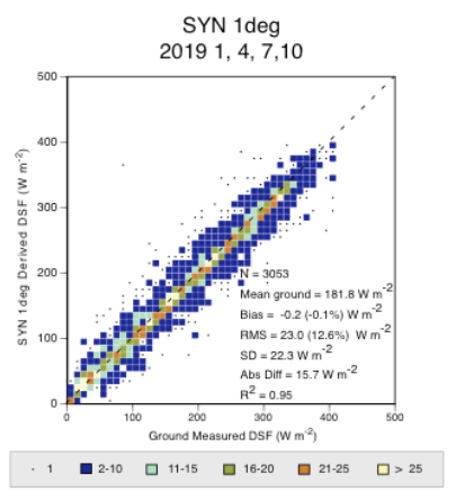
A summary of all-sky shortwave (SW) radiative fluxes on a horizontal surface from NASA’s CERES SYN1deg (Ed4.1) validated against BSRN site observations is presented below. The monthly and daily validations are computed for April 2000 through December 2020, while hourly validation covers Jan., Apr., Jul., and Oct. 2019.
| Parameter | Region | Bias (%) | RMSE (%) |
|---|---|---|---|
| Hourly SW All-Sky Insolation Mid-seasonal months 2019 | All Sites 60° Poleward 60° Equatorward | -0.1 -1.9 0.9 | 12.6 19.4 13.1 |
| Daily SW All-Sky Insolation 2000–2020 | All Sites 60° Poleward 60° Equatorward | 0.3 2.1 0.2 | 13.5 36.5 12.1 |
| Monthly SW All-Sky Insolation 2000–2020 | All Sites 60° Poleward 60° Equatorward | 0.03 1.2 -0.03 | 5.7 20.2 4.7 |
| Daily SW DHI 2000–2020 | All Sites 60° Poleward 60° Equatorward | -0.6 -7.1 0.5 | 28.8 46.0 25.3 |
| Monthly SW DHI 2000–2020 | All Sites 60° Poleward 60° Equatorward | -0.1 -5.4 -0.03 | 15.0 30.5 12.0 |
| Daily SW DNI 2000–2020 | All Sites 60° Poleward 60° Equatorward | 3.5 16.6 2.4 | 36.3 99.4 30.1 |
| Monthly SW DNI 2000–2020 | All Sites 60° Poleward 60° Equatorward | 2.0 13.0 1.3 | 13.7 38.3 12.1 |
Comparison Plots: NASA’s CERES SYN1deg (Ed4.1) to BSRN Data: Global Horizontal Irradiance (GHI)
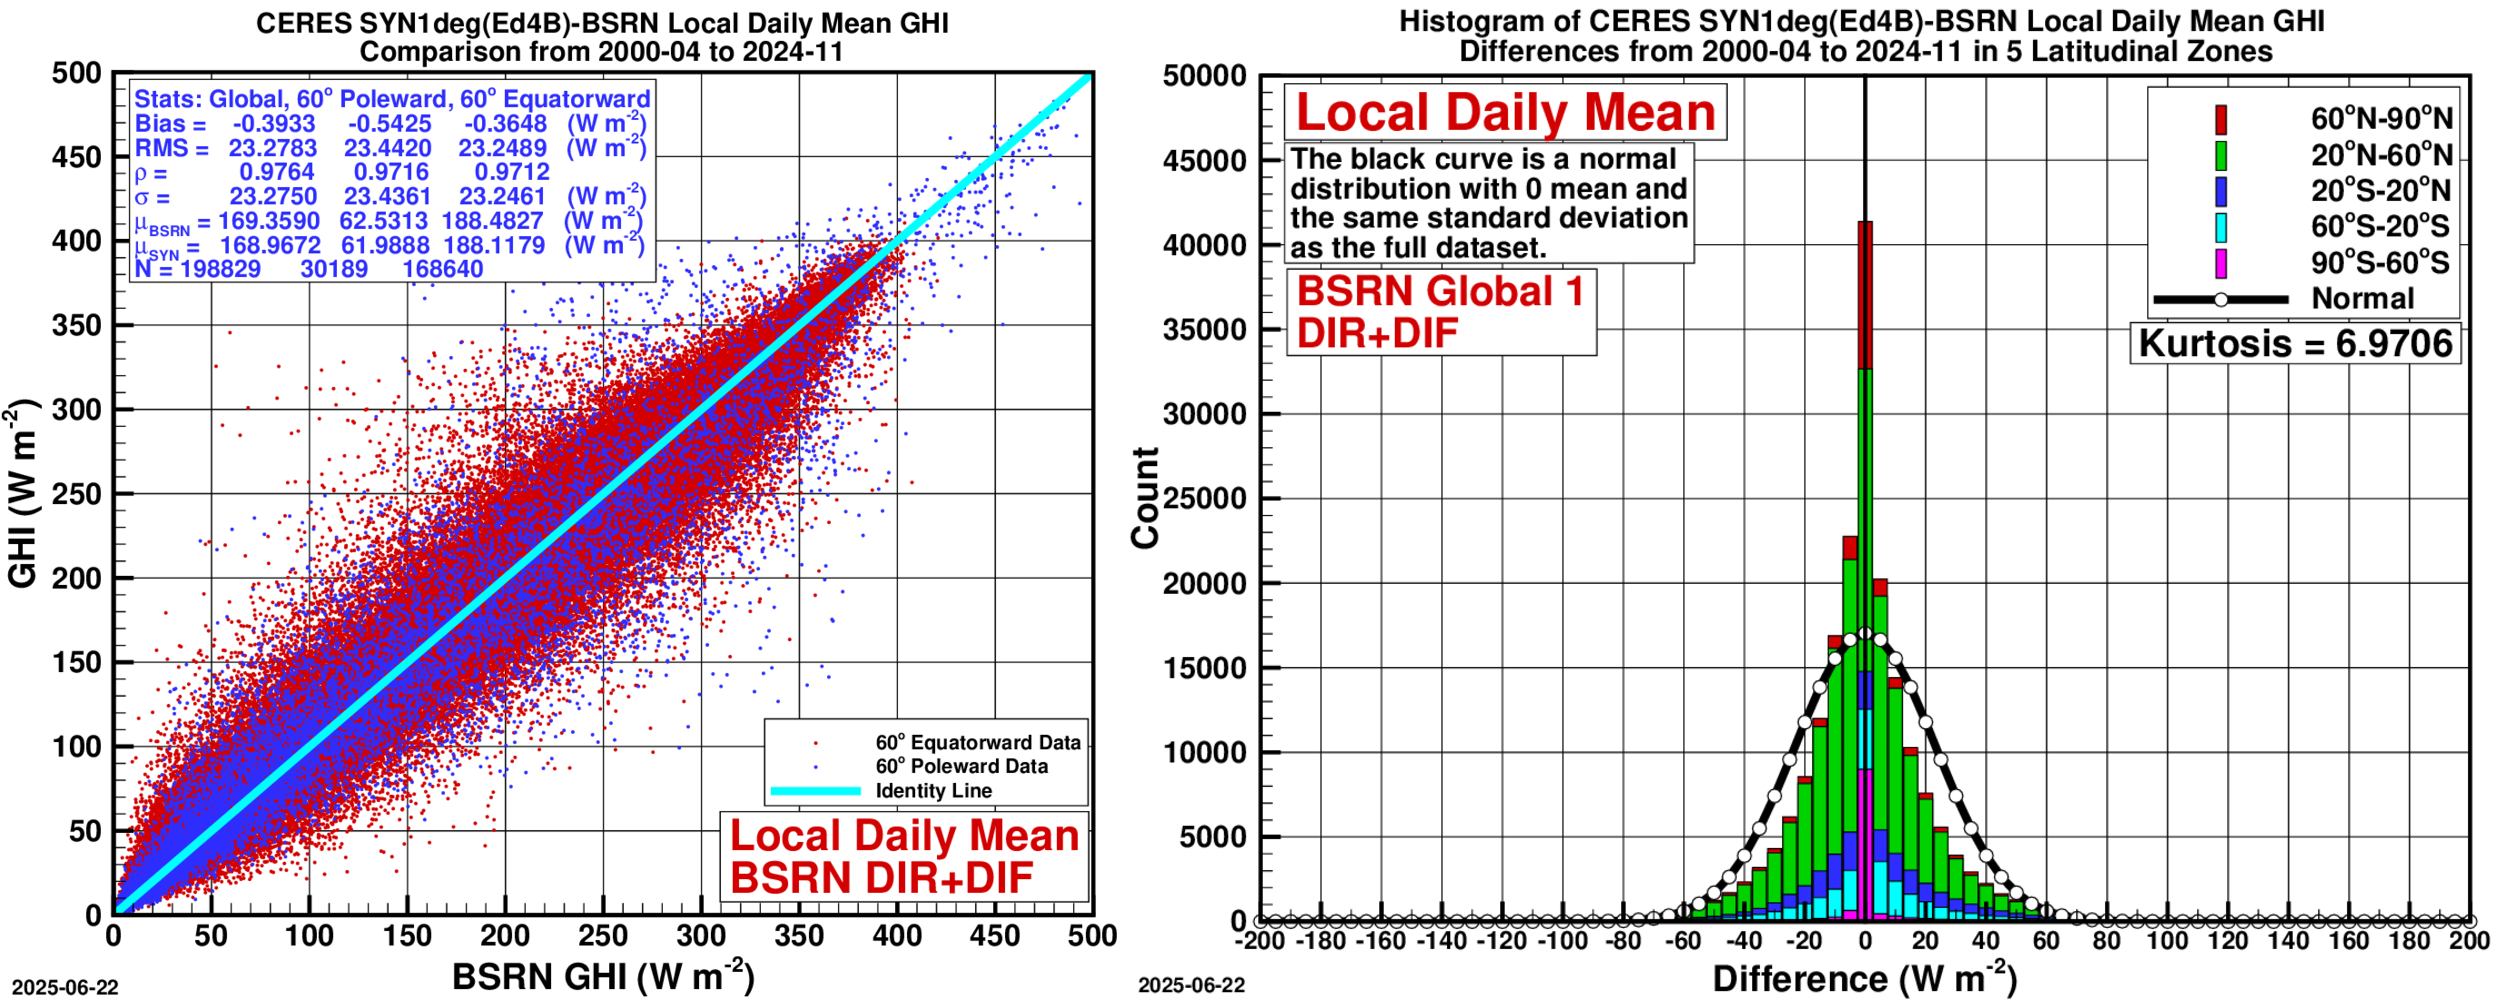
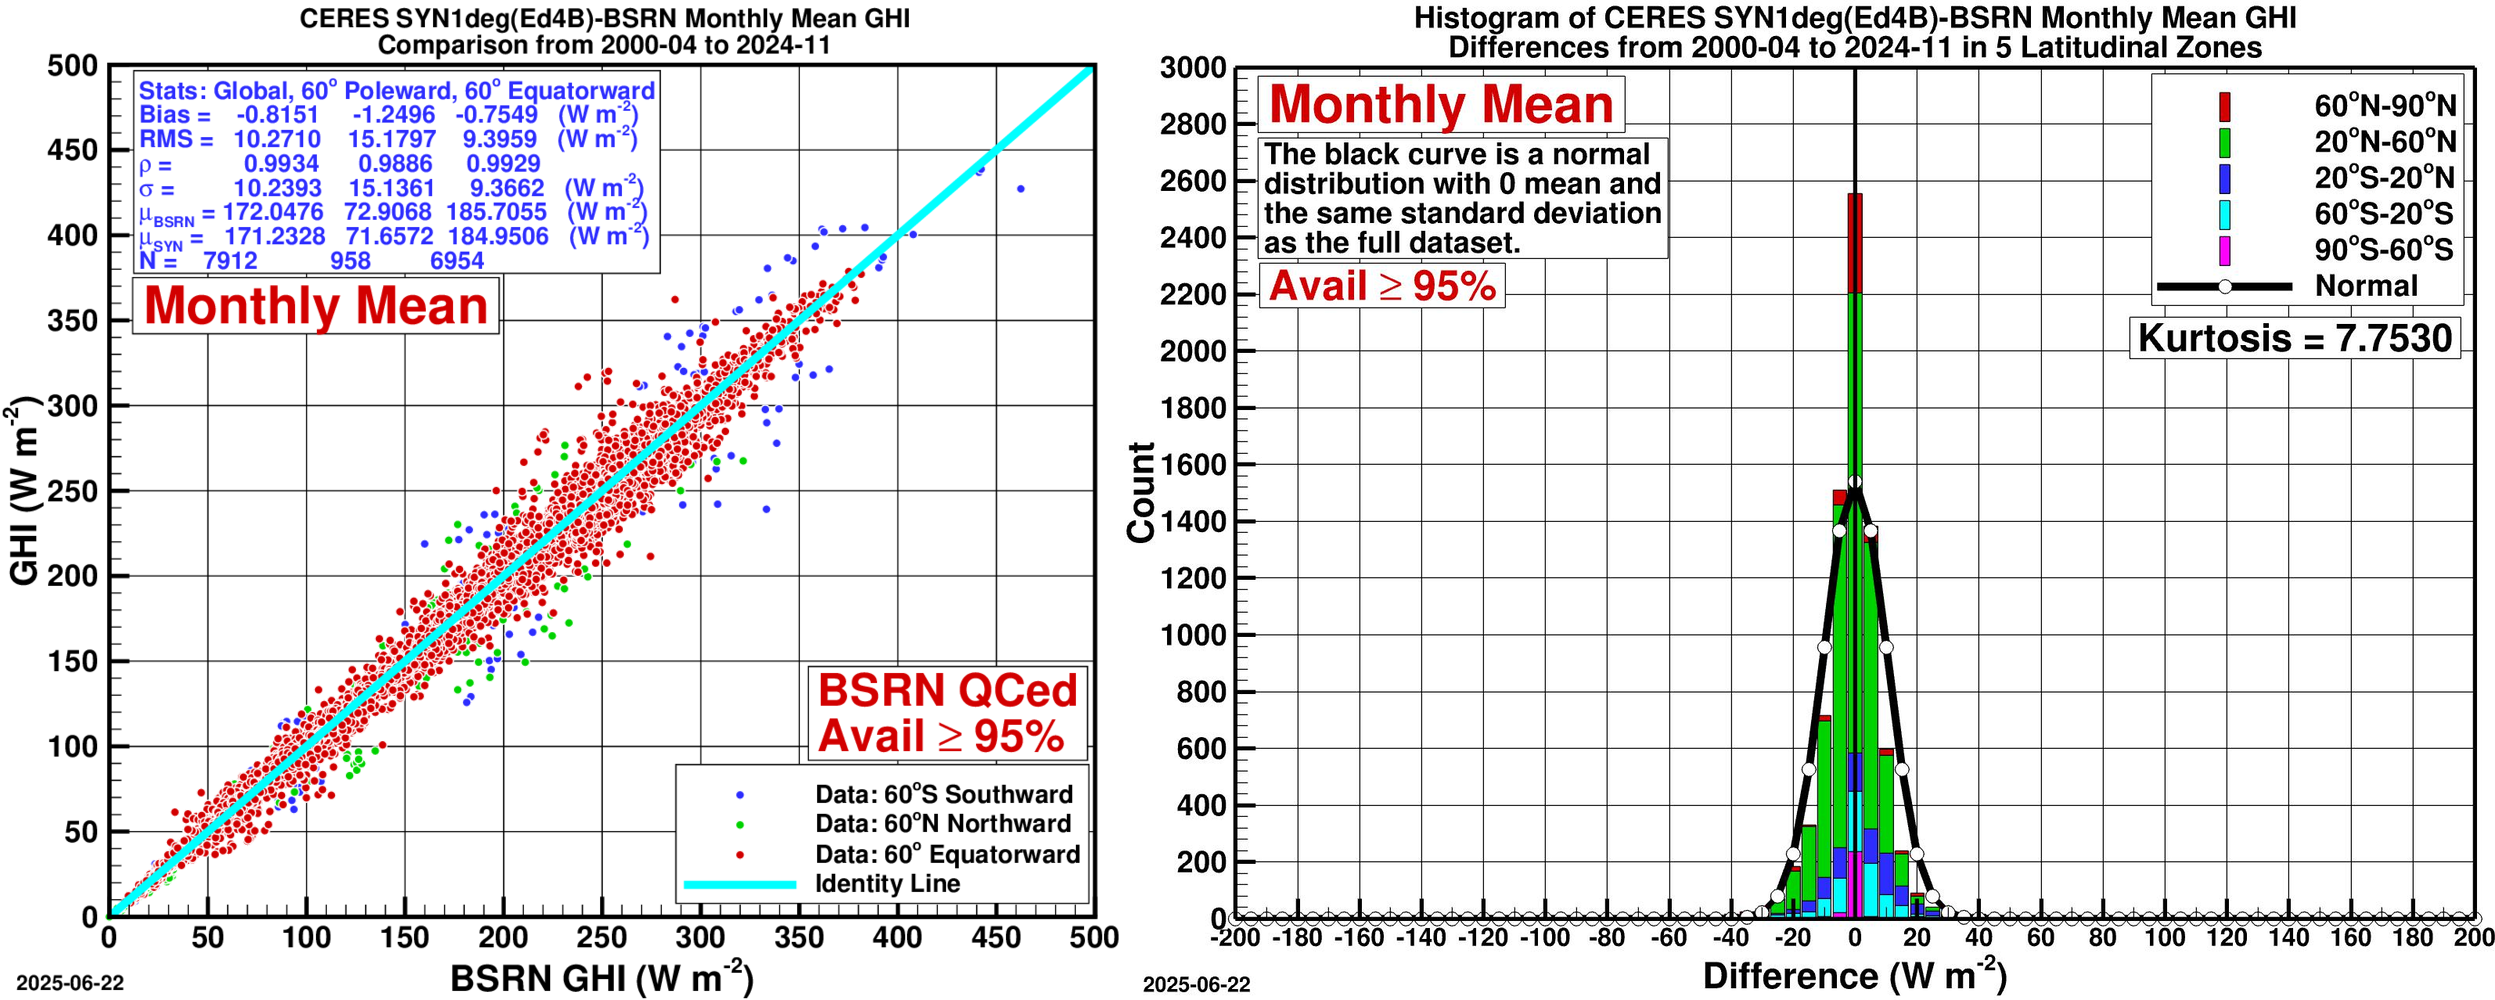
- Left — Scatter Plot:
- Right — Histogram of Differences:
Comparison Plots: NASA’s CERES SYN1deg (Ed4.1) to BSRN Data: Direct Horizontal Irradiance (DHI)
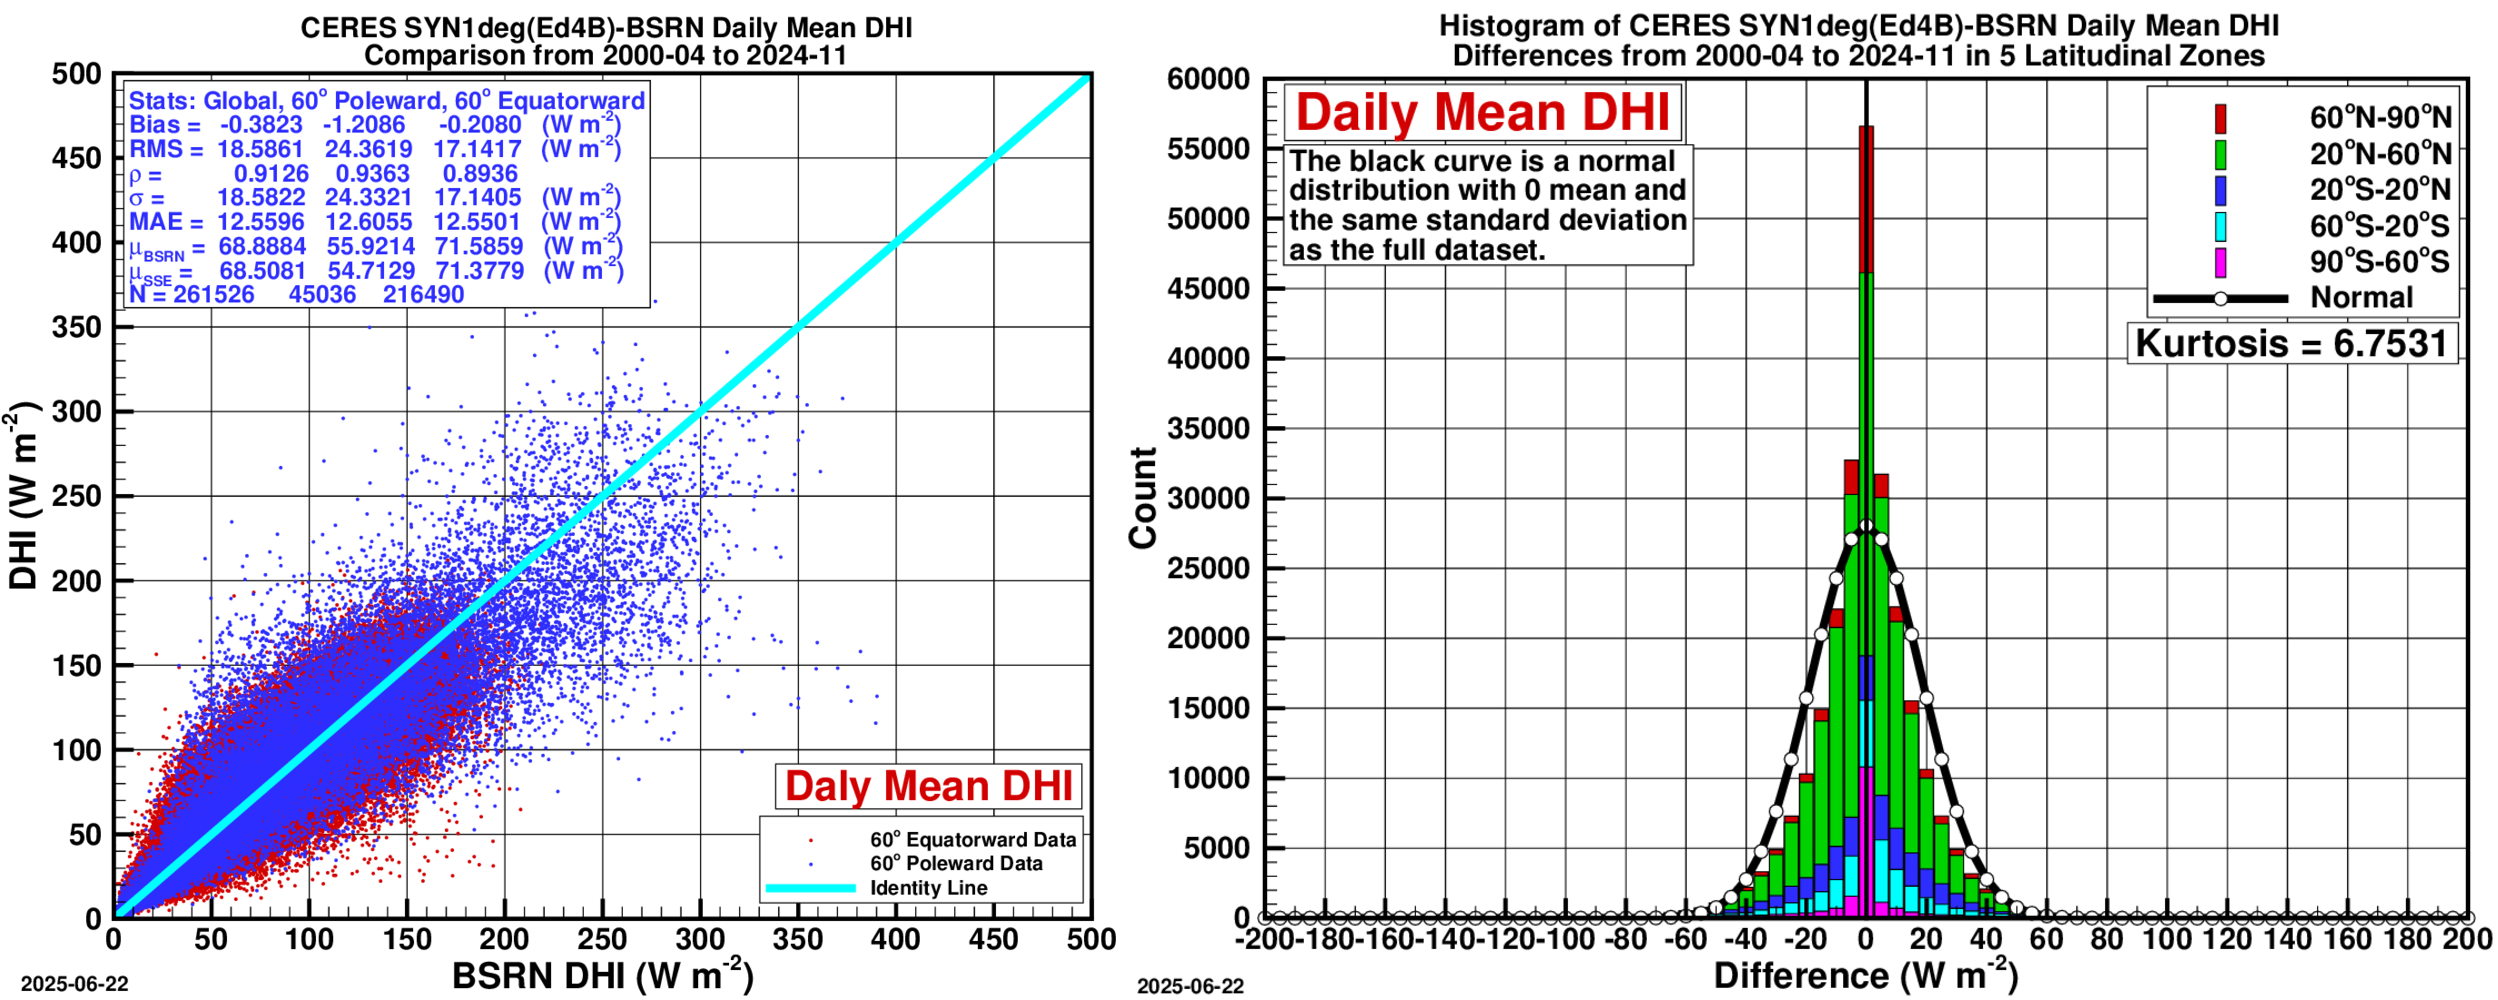
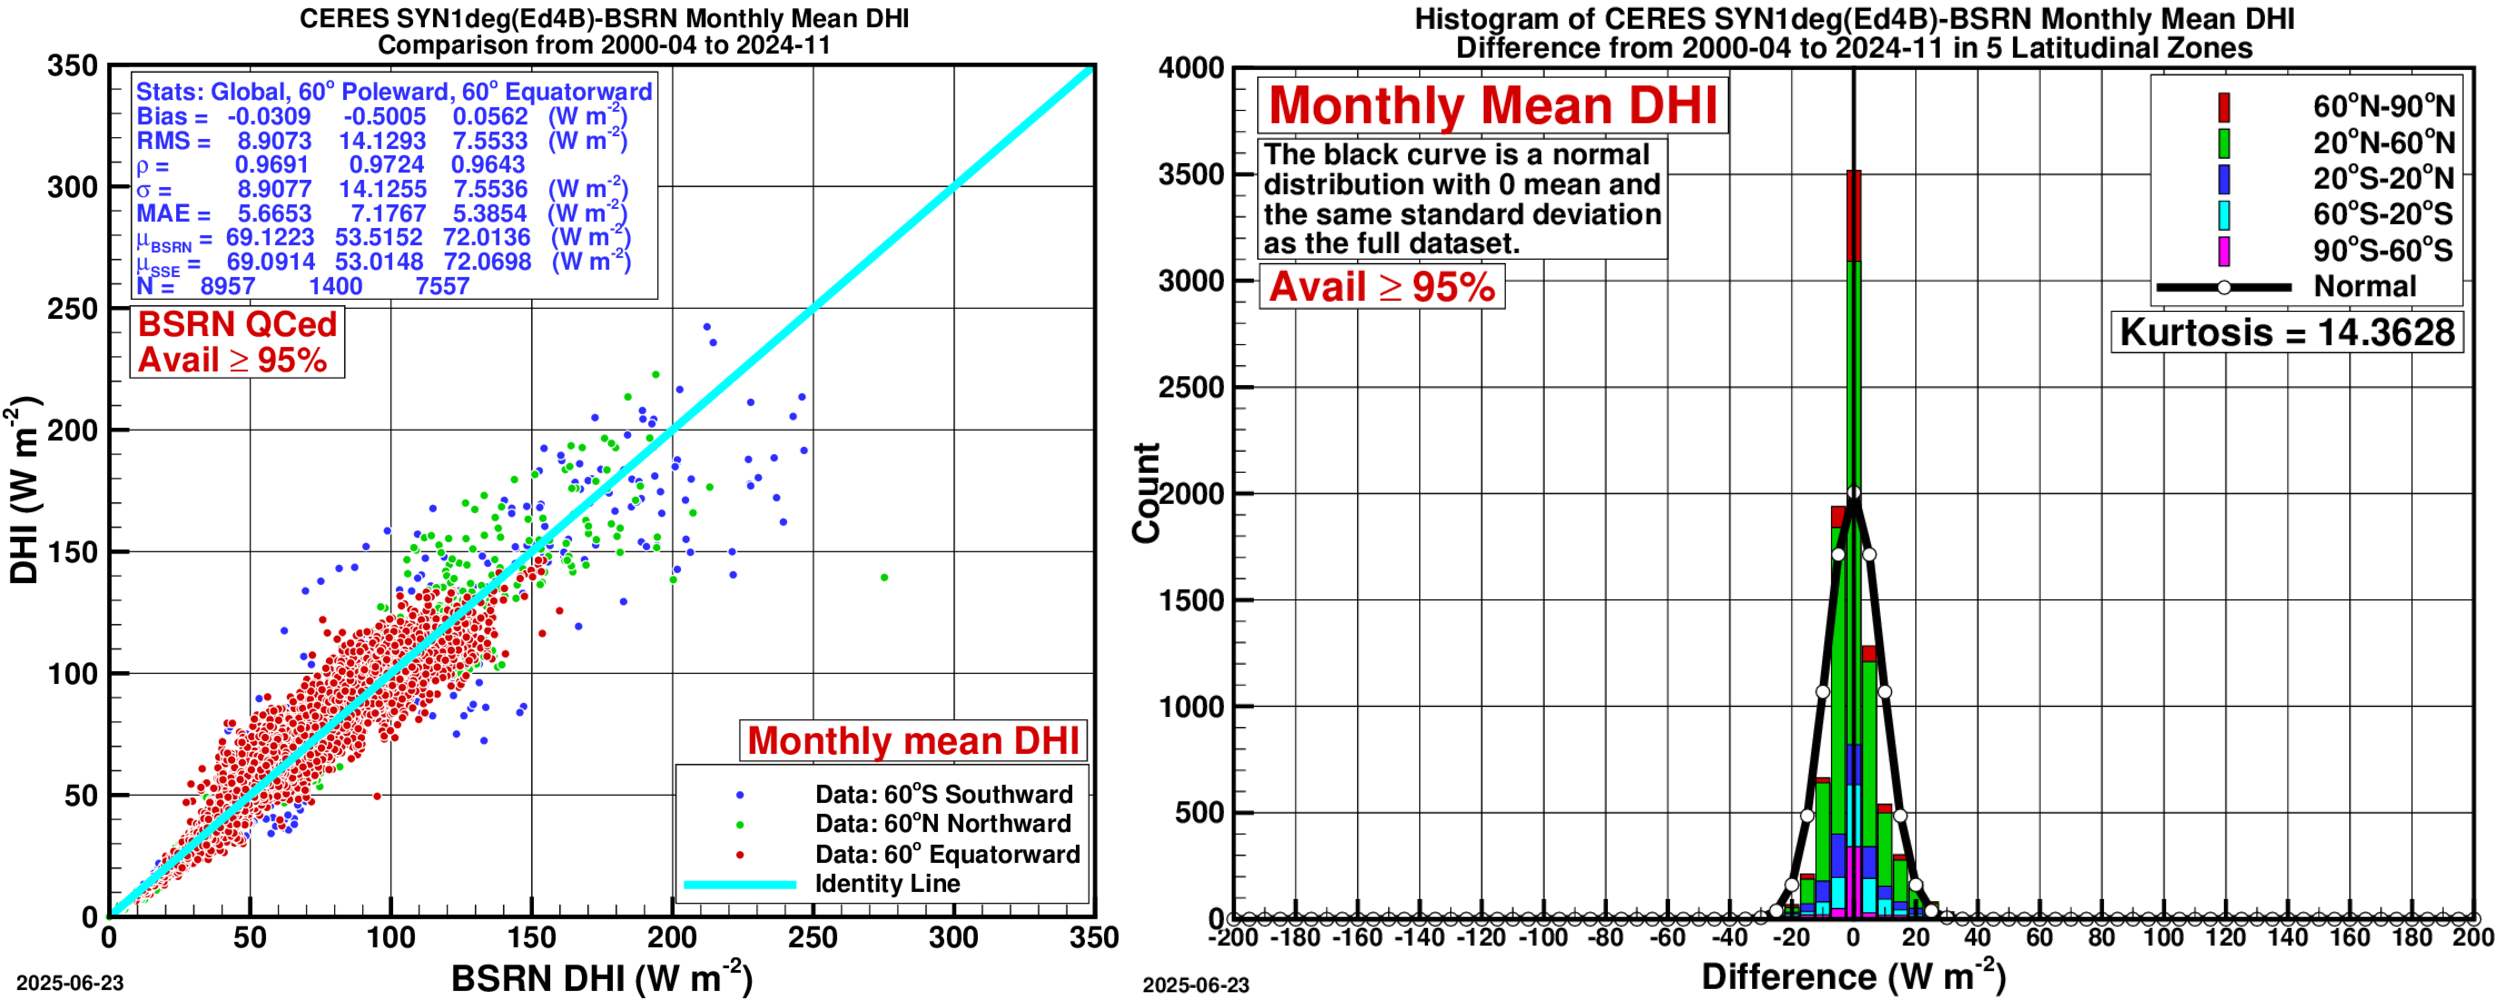
- Left — Scatter Plot:
- Right — Histogram of Differences:
Comparison Plots: NASA’s CERES SYN1deg (Ed4.1) to BSRN Data: Direct Normal Irradiance (DNI)
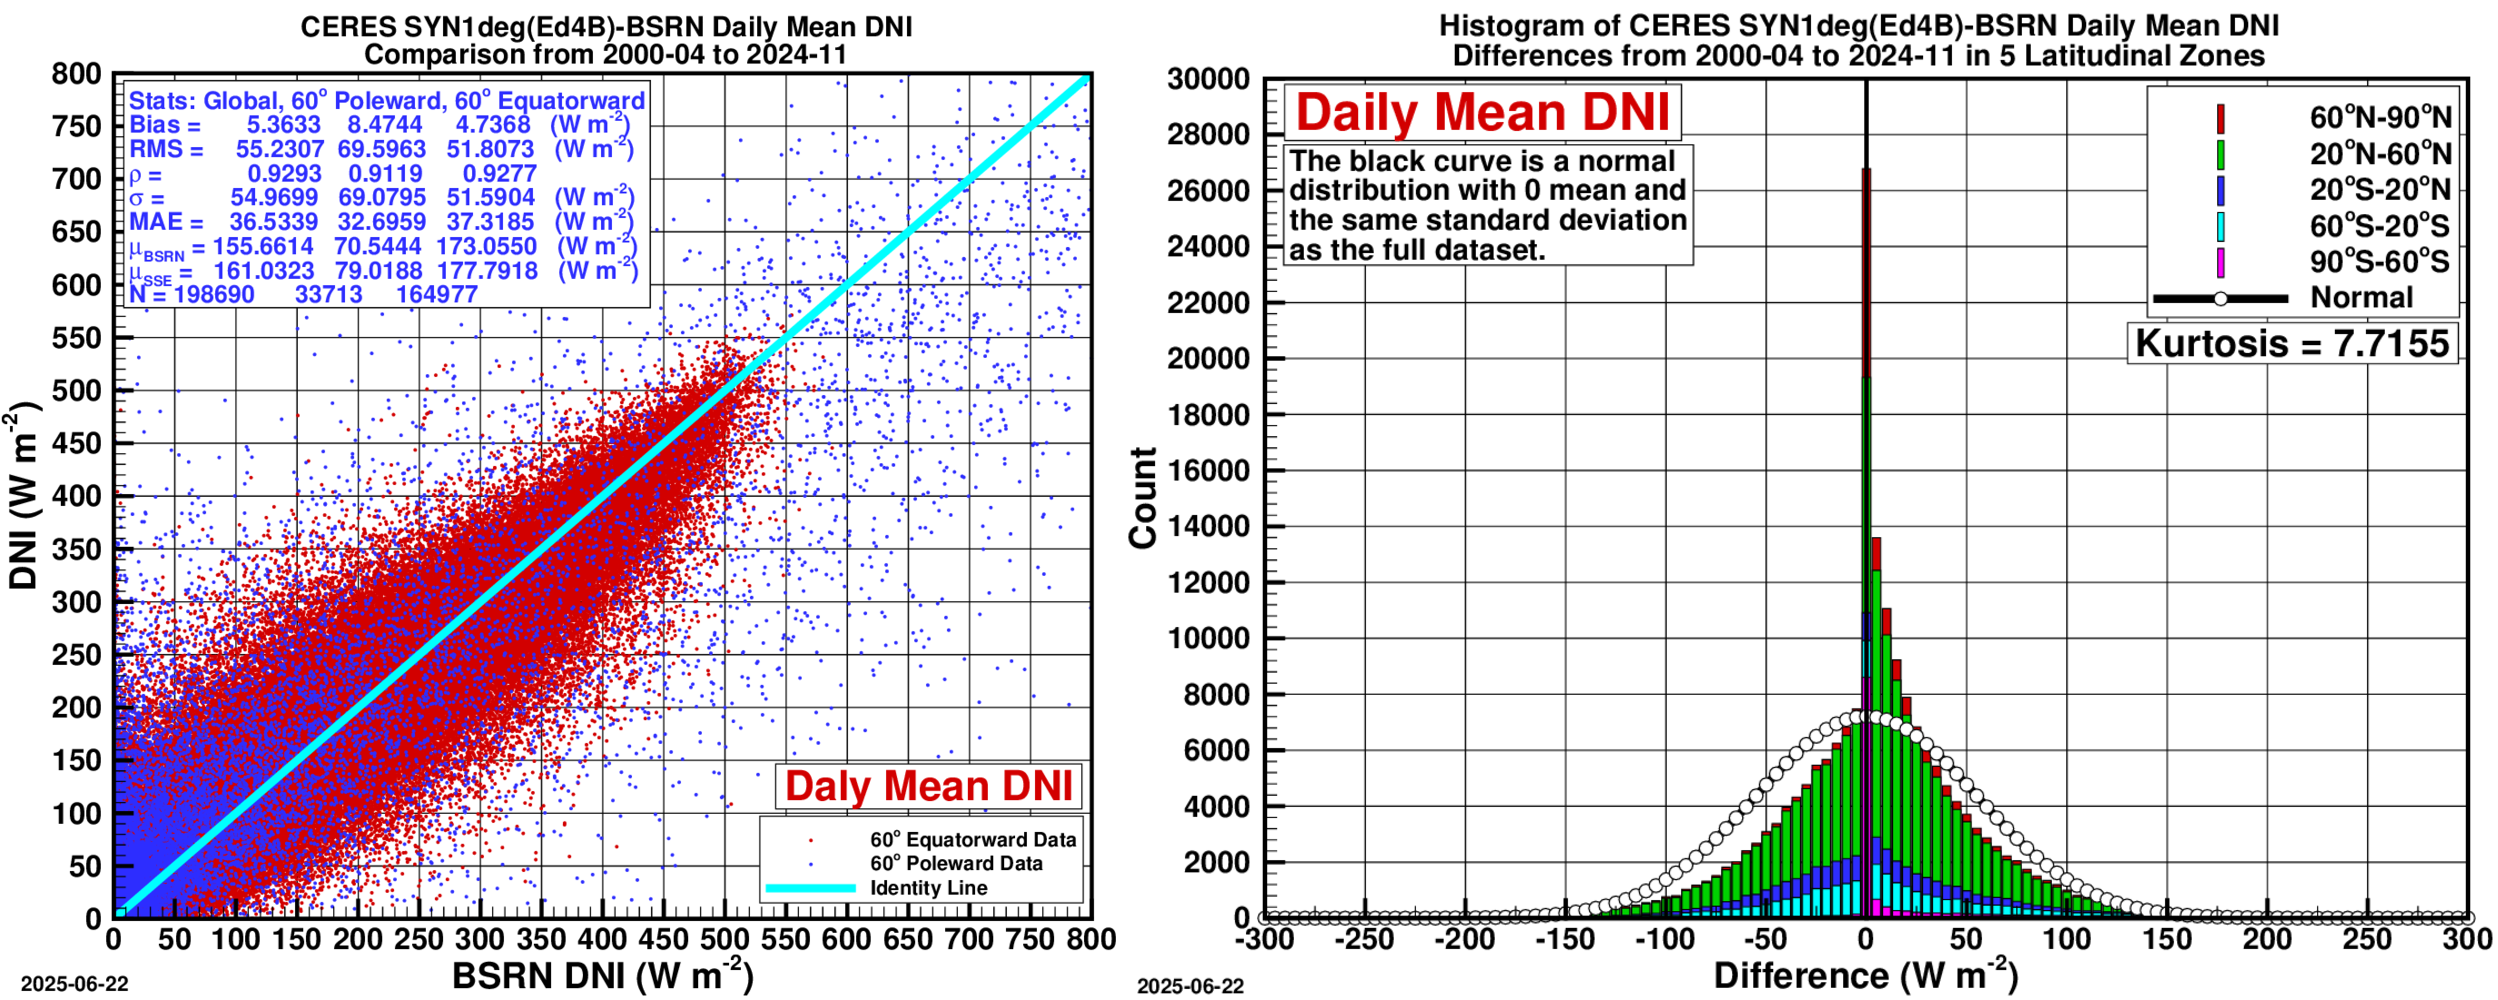
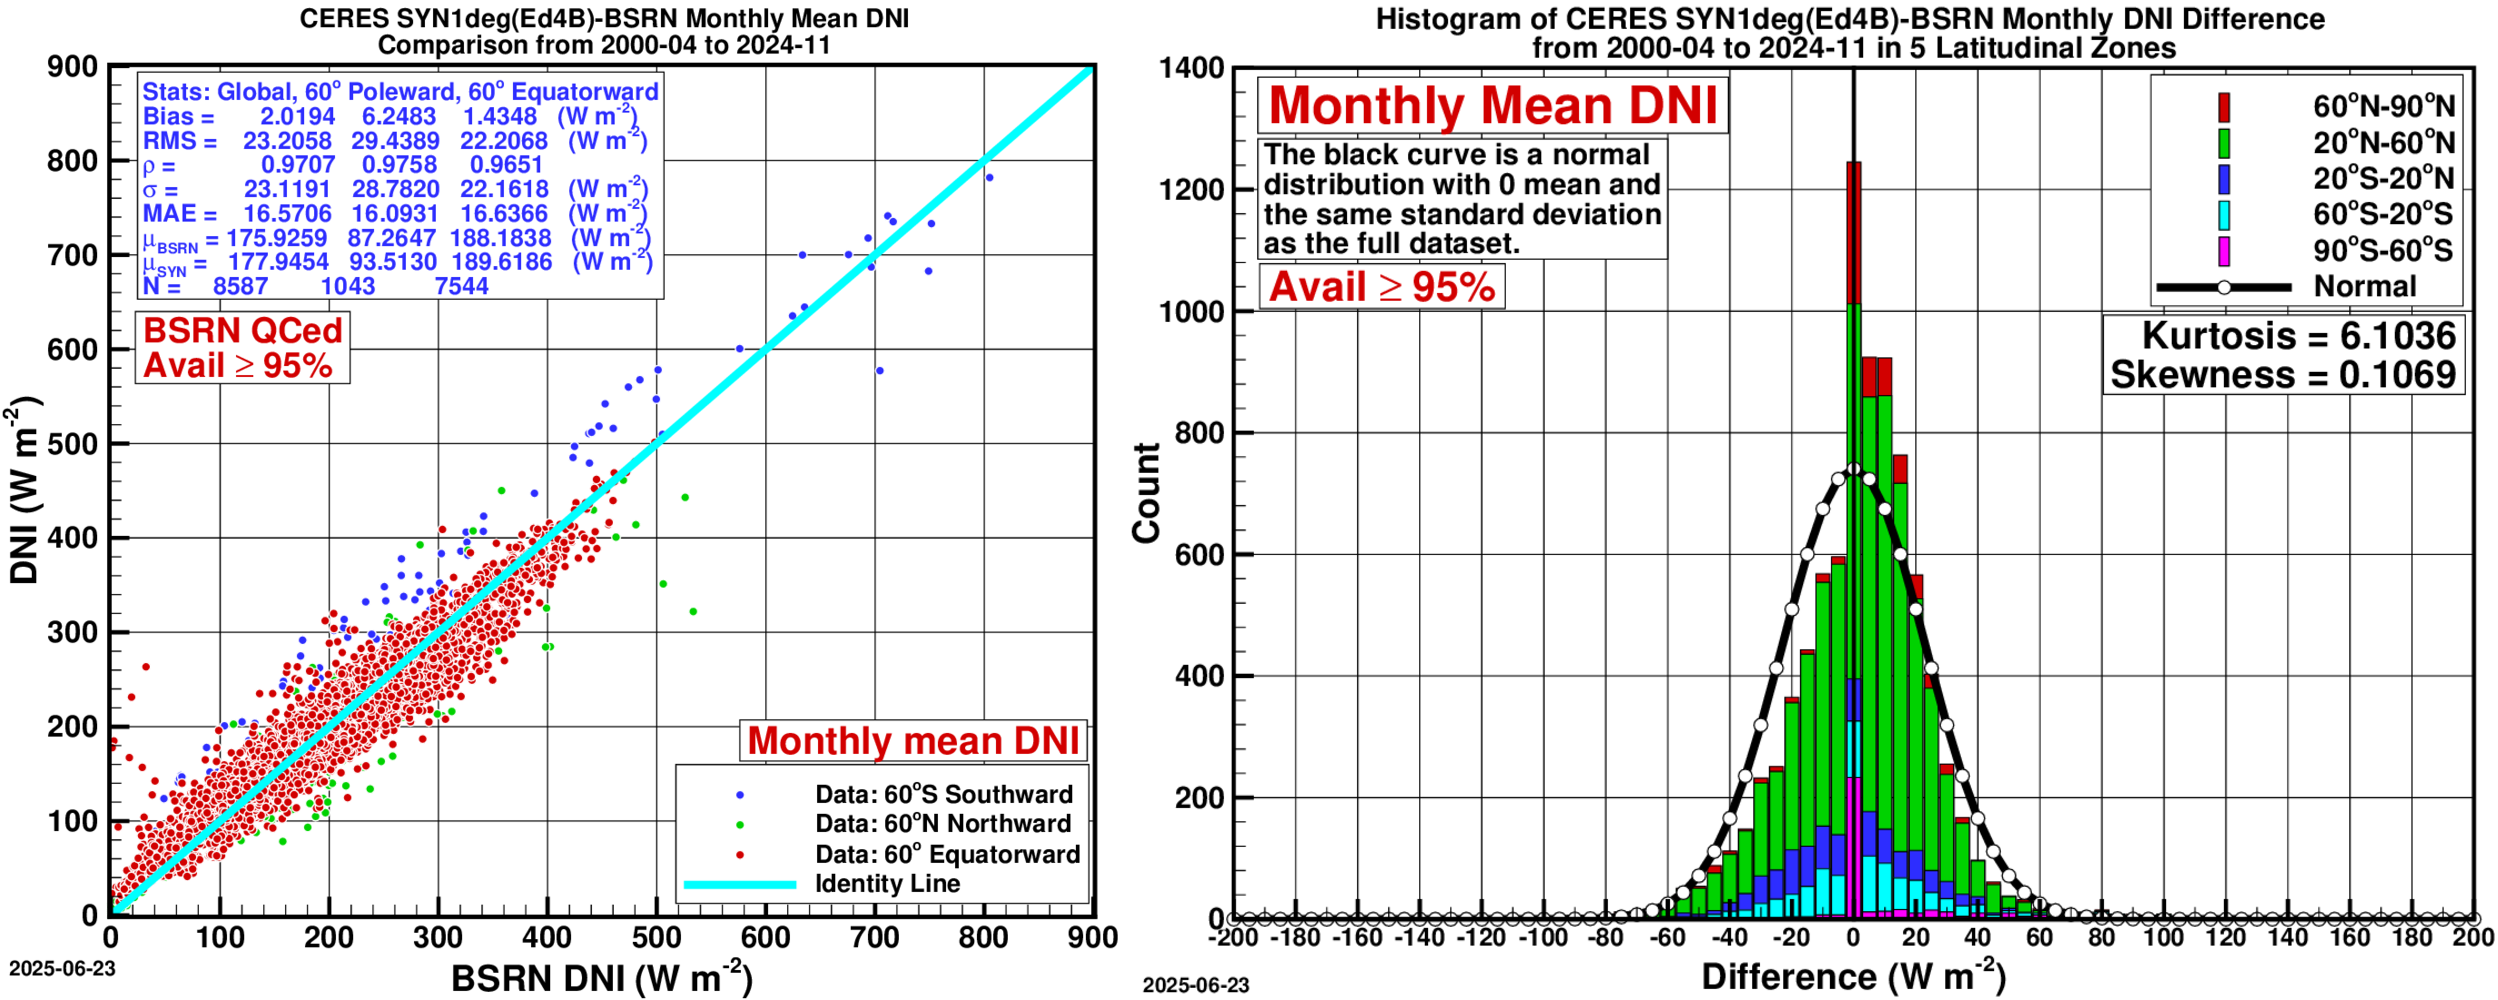
- Left — Scatter Plot:
- Right — Histogram of Differences:
CERES FLASHFlux
A summary of all-sky shortwave (SW) radiative fluxes on a horizontal surface from NASA’s FLASHFlux 4A validated against values from BSRN sites for Jan., Apr., Jul., and Oct. 2019 is presented below.
| Parameter | Region | Bias (%) | RMSE (%) |
|---|---|---|---|
| Hourly Mean SW All-Sky Insolation Mid-seasonal months 2019 NASA’s FLASHFlux 4A | All Sites 60° Poleward 60° Equatorward | -1.8 1.6 -2.2 | 15.3 23.4 16.1 |
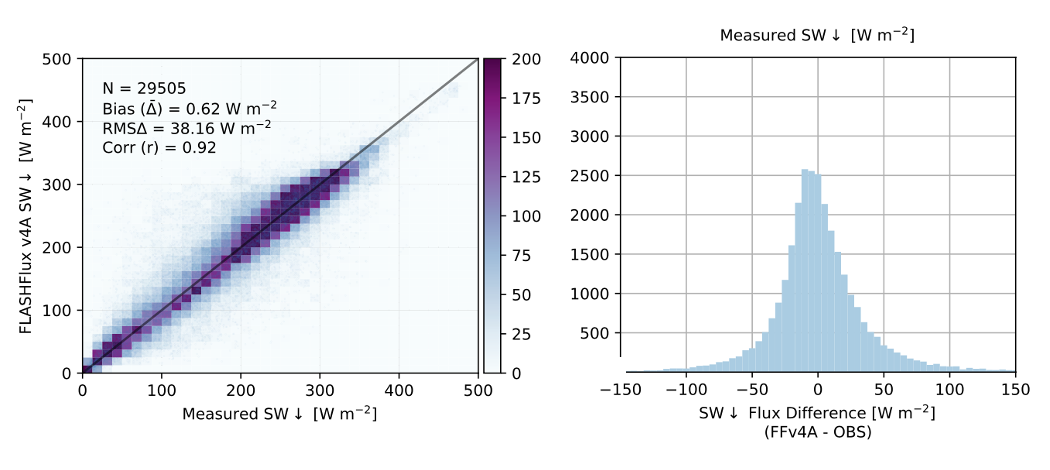
Comparison Plots: NASA’s FLASHFlux 4A to BSRN Data
Hourly covers Jan., Apr., Jul., and Oct. 2019, while daily covers Jan. 2019 through Dec. 2020.
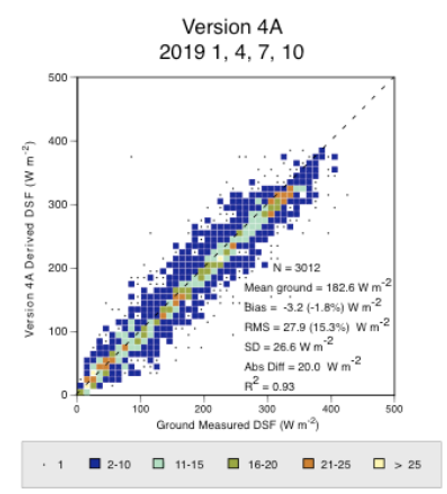
Hourly: Scatter Density Plot
Daily: Scatter Density Plot (left), Histogram (right)