Solar Direct and Diffuse Adjustment
Explanation of Problem
The CERES SYN1deg (Ed4.1) hourly solar irradiance data span the period from March 2000 to near present time and are the current source data for the POWER Project. Two versions of the CERES SYN1deg (Ed4.1) hourly irradiances are available, the initial and adjusted. Based on comparisons with the Baseline Surface Radiation Network (BSRN) data, we found that the adjusted GHI agree somewhat better with the BSRN than the initial one. The overall bias/\sigma of the adjusted version are 2.91/83.44 W m-2 and of the initial version are -4.51/82.44 W m-2 where \sigma stands for standard deviation; in a 20-bin analysis of the cosine of the solar zenith angle (cos(Z)), we found that except in a few extreme bins, the adjusted version is slightly better than the initial version in most of the bins. Henceforth, all CERES SYN1deg data refer to the adjusted version.
Beside the hourly Global Horizontal Irradiance (GHI) and Diffuse Horizontal Irradiance (DHI), the POWER Project derives the Direct Normal Irradiance (DNI) by dividing the Direct Horizontal Irradiance (DirHI) by cos(Z). However, we found that, although the initial CERES SYN1deg (Ed4.1) DHI and DirHI sum to the GHI that agree reasonably well with the BSRN data, the DHI and DirHI show appreciable positive and negative biases, respectively, against the BSRN data and, therefore, the derived DNI, or DirHI/cos(Z) also show significant biases against the BSRN data. To be precise, the overall bias/\sigma of the DHI are 30.58/80.23 W m-2, and in the 20 bins of cos(Z), the bias increases steadily from -2.29 to 116.22 W m-2, or from -21.78% to 41.75% of the mean BSRN DHI; the overall bias/\sigma of the DirHI are -37.09/116.48 W m-2, and in the 20 bins of cos(Z), the bias changes from -2.18 to -90.40 W m-2, or from -45.54% to -16.64% of the mean BSRN DirHI; the overall bias/\sigma of the derived DNI, or DirHI/cos(Z), are -54.32/196.35 W m-2, and in the 20 bins of cos(Z) goes from 40.17 to 93.94 W m-2, or from 89.97% to -16.79% of the mean BSRN DNI. 1
We have previously applied the DirIndex model to the GEWEX SRB GSW (Rel.3) 3-hourly GHI to derive the 3-hourly DNI 2 3, since the solar energy community is particularly interested in the DNI. The DirIndex model requires the inputs of the all-sky and clear-sky GHI along with surface pressure, aerosol optical depth at 700 nm, and atmospheric water vapor. The DirIndex model has been found to be one of the two best global-to-beam models from among 140 separation models 4. More recently, we applied the DirIndex model to the CERES SYN1deg (Ed4.0) hourly data to get the DNI 5, and the overall bias/\sigma are found to be 8.54/228.81 W m-2. This \sigma is about 17% larger than that of the DNI derived from the initial CERES SYN1deg (Ed4.1) DirHI, or DirHI/cos(Z). This implies that the DNI derived from the initial CERES SYN1deg (Ed4.1) hourly DirHI, while significantly biased in a systemic way, captures the spatiotemporal variability of the DNI more than the DirIndex model does, and in addition, it is possible to perform a simple bias-based adjustment to get a set of DNI with a smaller uncertainty than that of the DirIndex model.
Initial Data
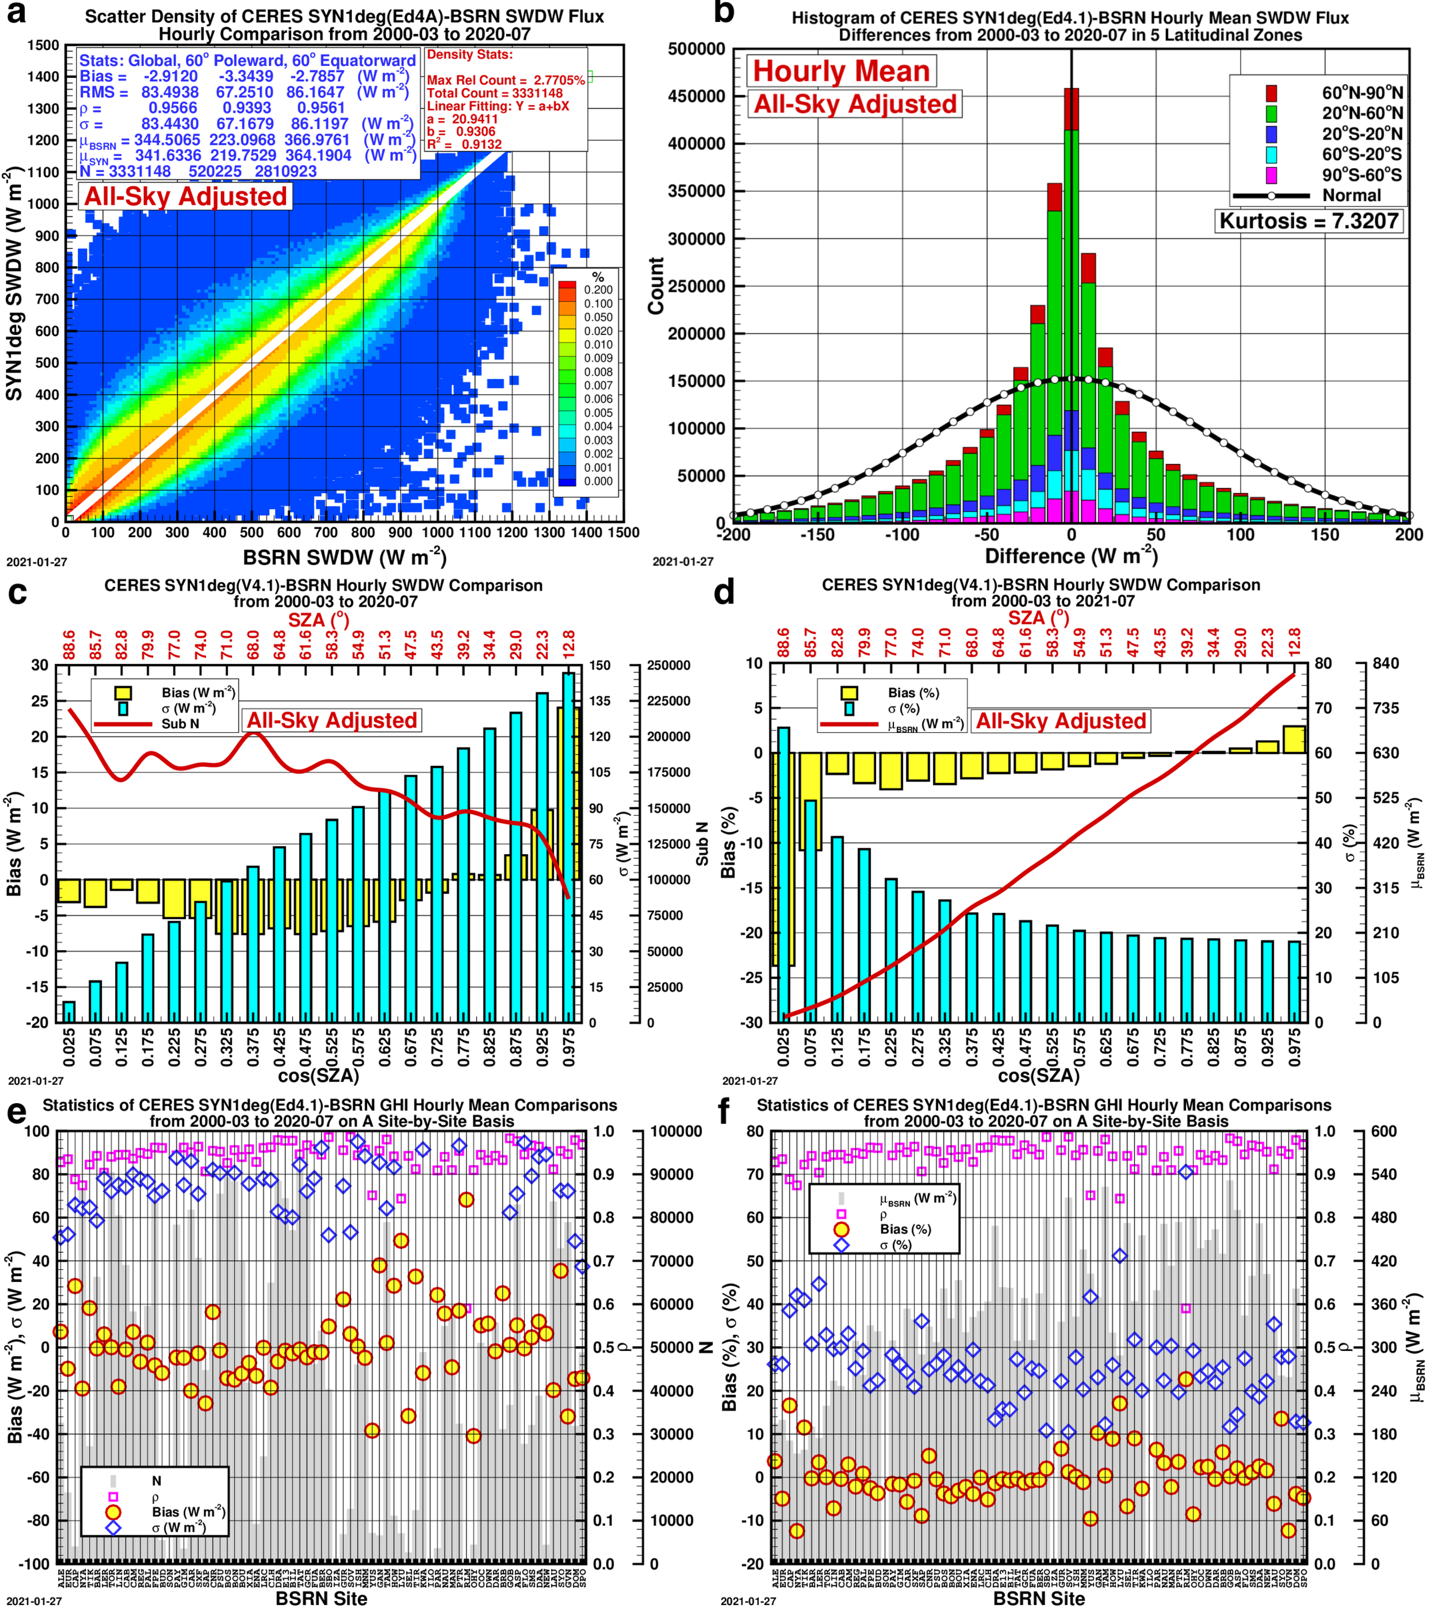
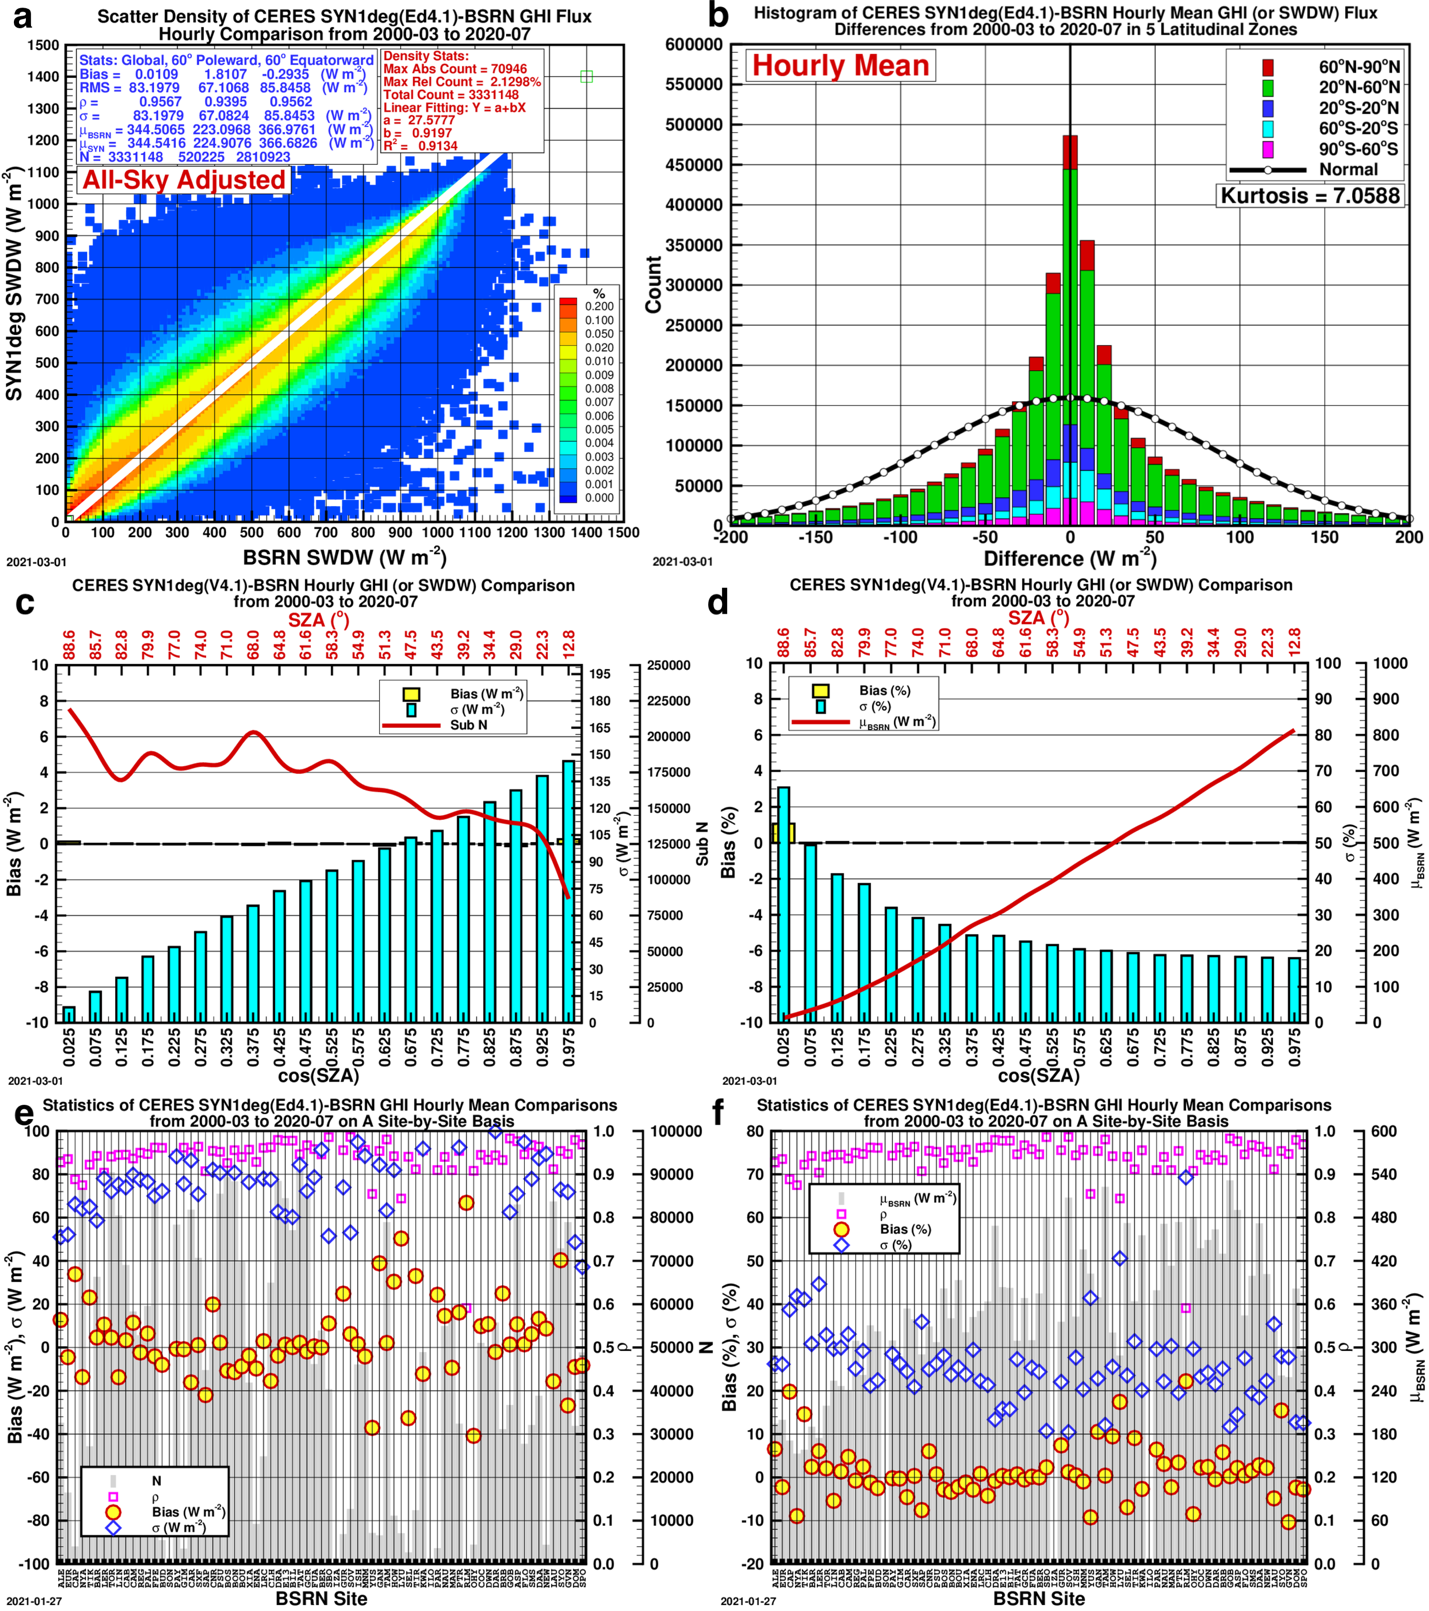
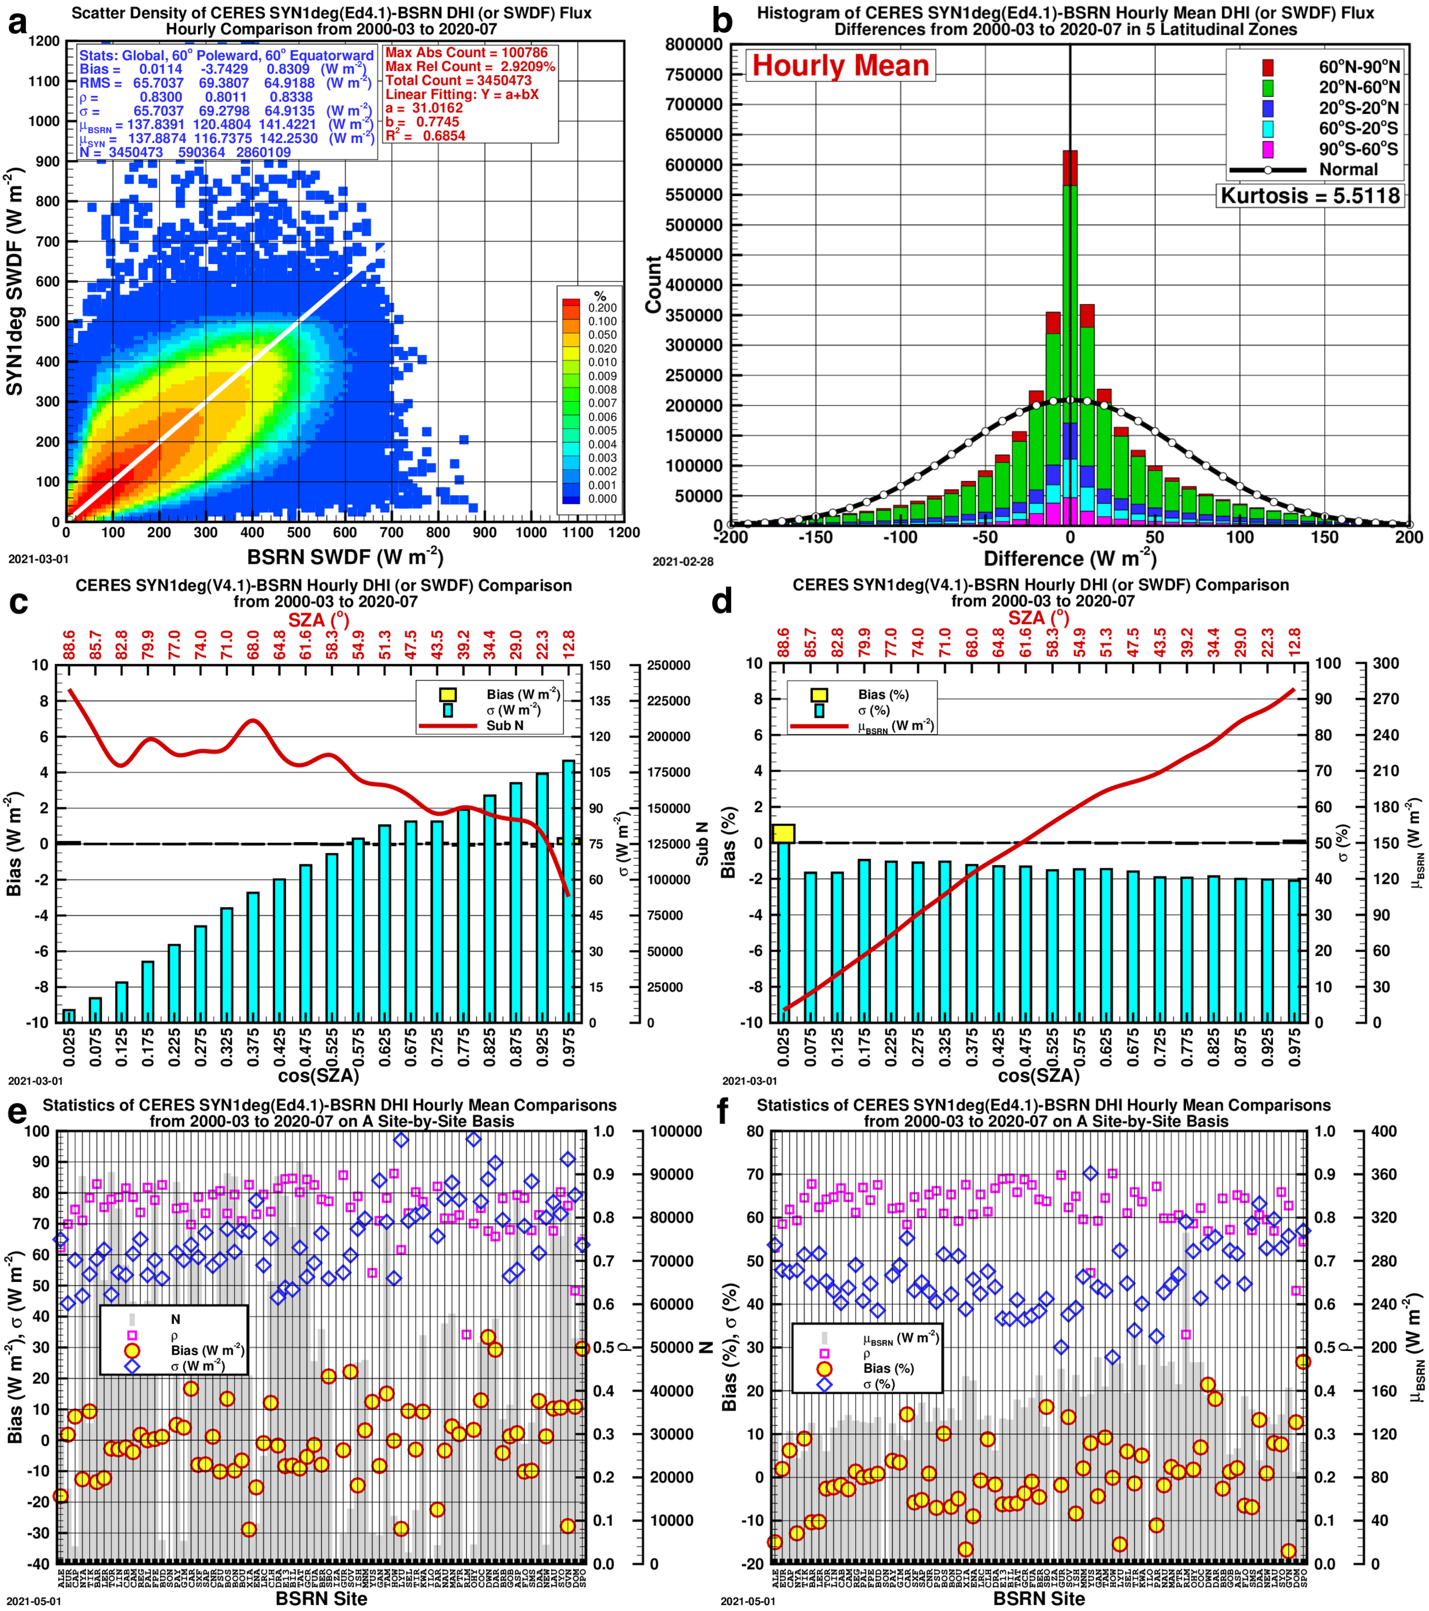
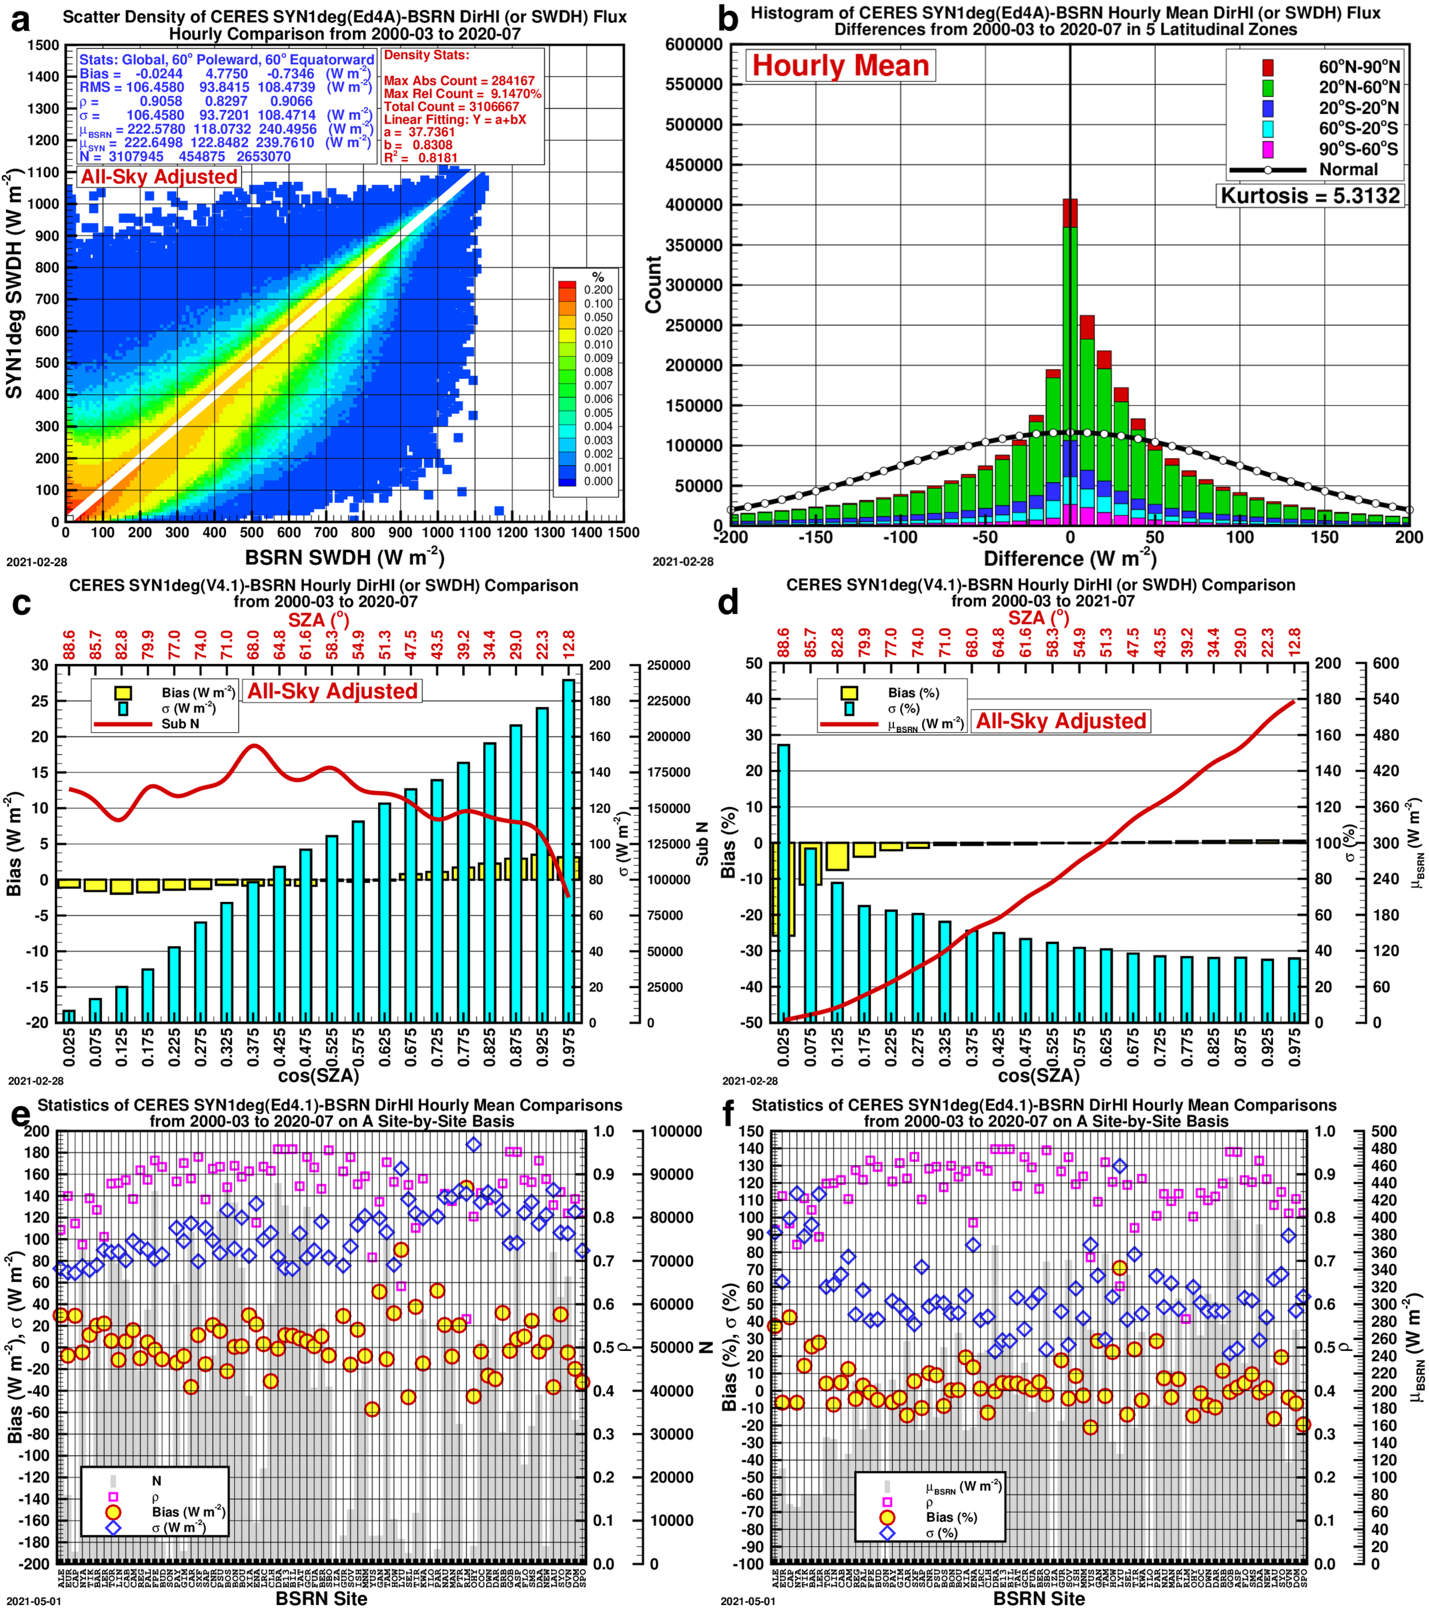
Figures 1-4, below, show the comparison of the initial CERES SYN1deg (Ed4.1) hourly GHI, DHI, DirHI and DNI, or DirHI/cos(Z), with their respective BSRN counterparts.
In terms of the overall statistics, the GHI agree with the BSRN reasonably well. In most of the 20 bins of the cos(Z), the biases are negative; in the five bins approaching the zenith, or the overhead position of the Sun, the biases are positive, and in the last bin, the bias maximizes at 24.04 W m-2. (Figure 1c-d.)
The DHI, on the other hand, shows a positive overall bias of a significant magnitude, and in the 20 bins of cos(Z), the bias shows an unmistakable near-linear increasing trend on both the absolute and relative scales as shown in Figure 2c-d.
The DirHI is biased equally significantly (Figure 3c-d), though on the opposite side of DHI, because DirHI and DHI sum to GHI which agrees with the BSRN reasonably well. For this reason, the derived DNI, or DirHI/cos(Z), shows notable biases in the bins of cos(Z) (Figure 4c-d).
Comparison Plots: CERES SYN1deg (Ed4.1) to BSRN Data
The comparison plots for the comparison of the initial CERES SYN1deg (Ed4.1) hourly against the BSRN observed data for all-sky GHI, DHI, DirHI and DNI from 2000-03 to 2020-07.
- A — Scatter Density Plot: The statistics shown categorized as “Global” include all data points, “60° Poleward” and “60° Equatorward” split the data into those two categories.; \rho stands for correlation coefficient, \sigma standard deviation, \muBSRN the BSRN mean, and N the total number of data points.
- B — Histogram of Differences: Histogram of the CERES SYN1deg (Ed4.1)-BSRN hourly GHI differences.
- C & D — Bar Graphs of Bias: The biases in 20 bins of cos(Z) on absolute and relative scale, respectively.
- E & F — Scatter Plots of Bias by Site: The bias, \sigma and \rho on a site-by-site basis.
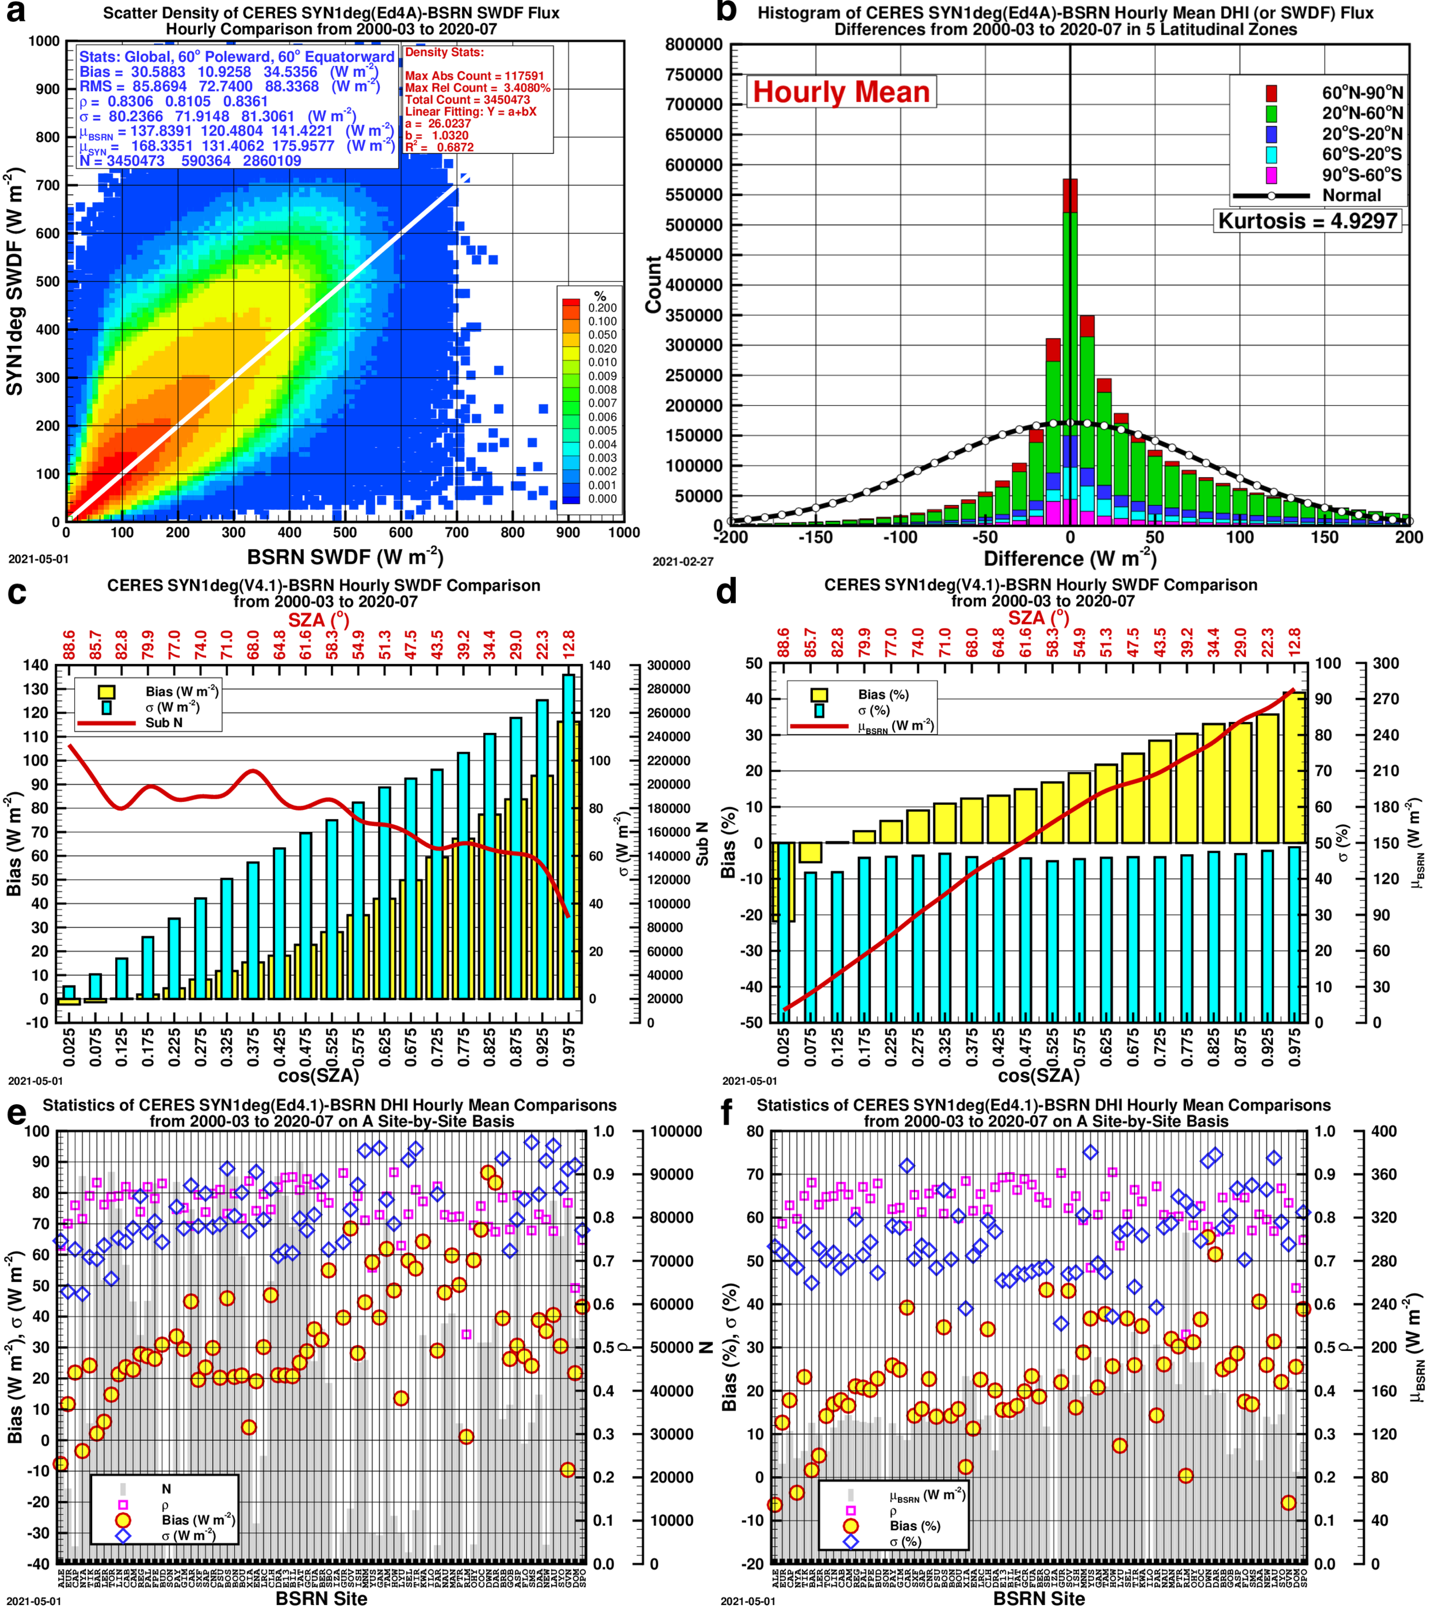
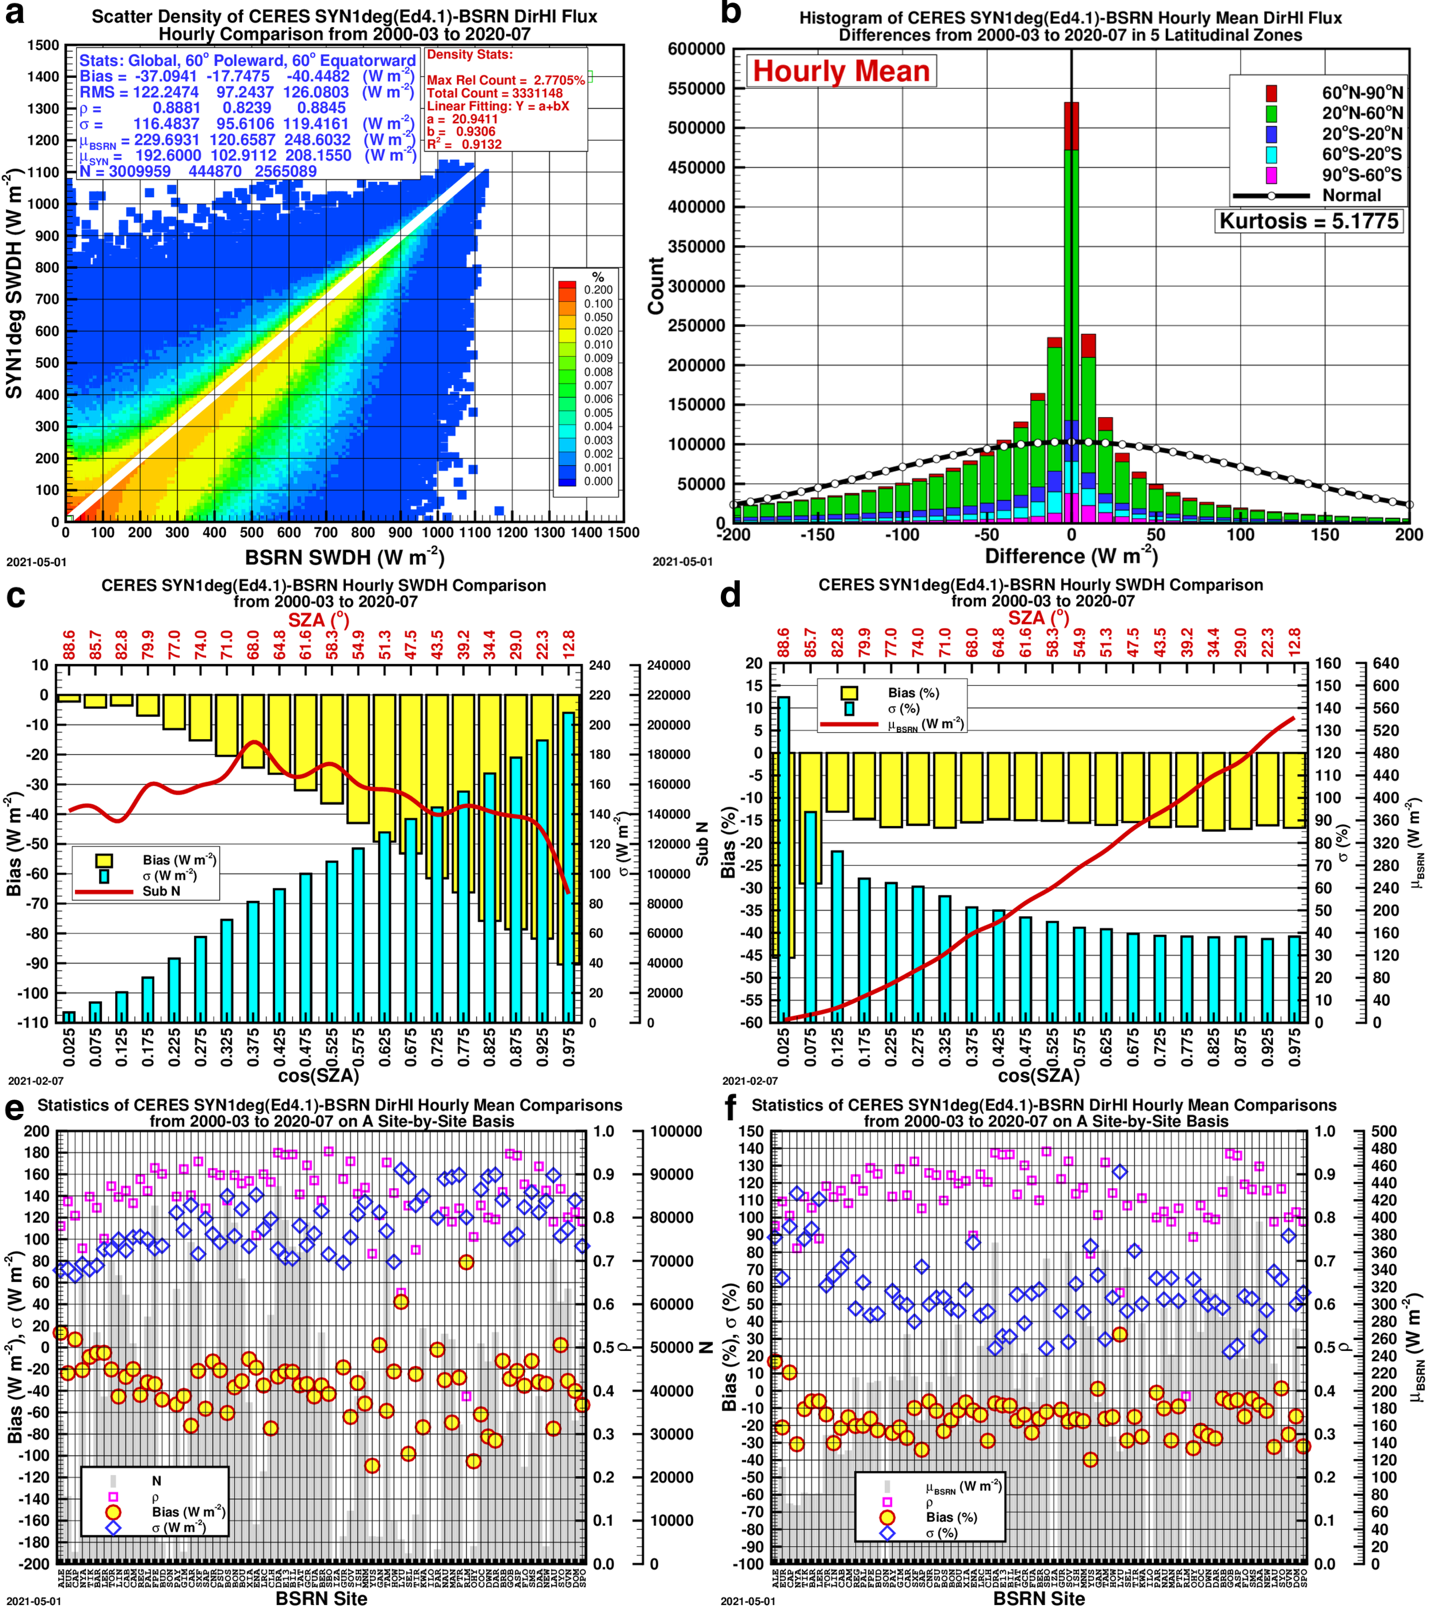
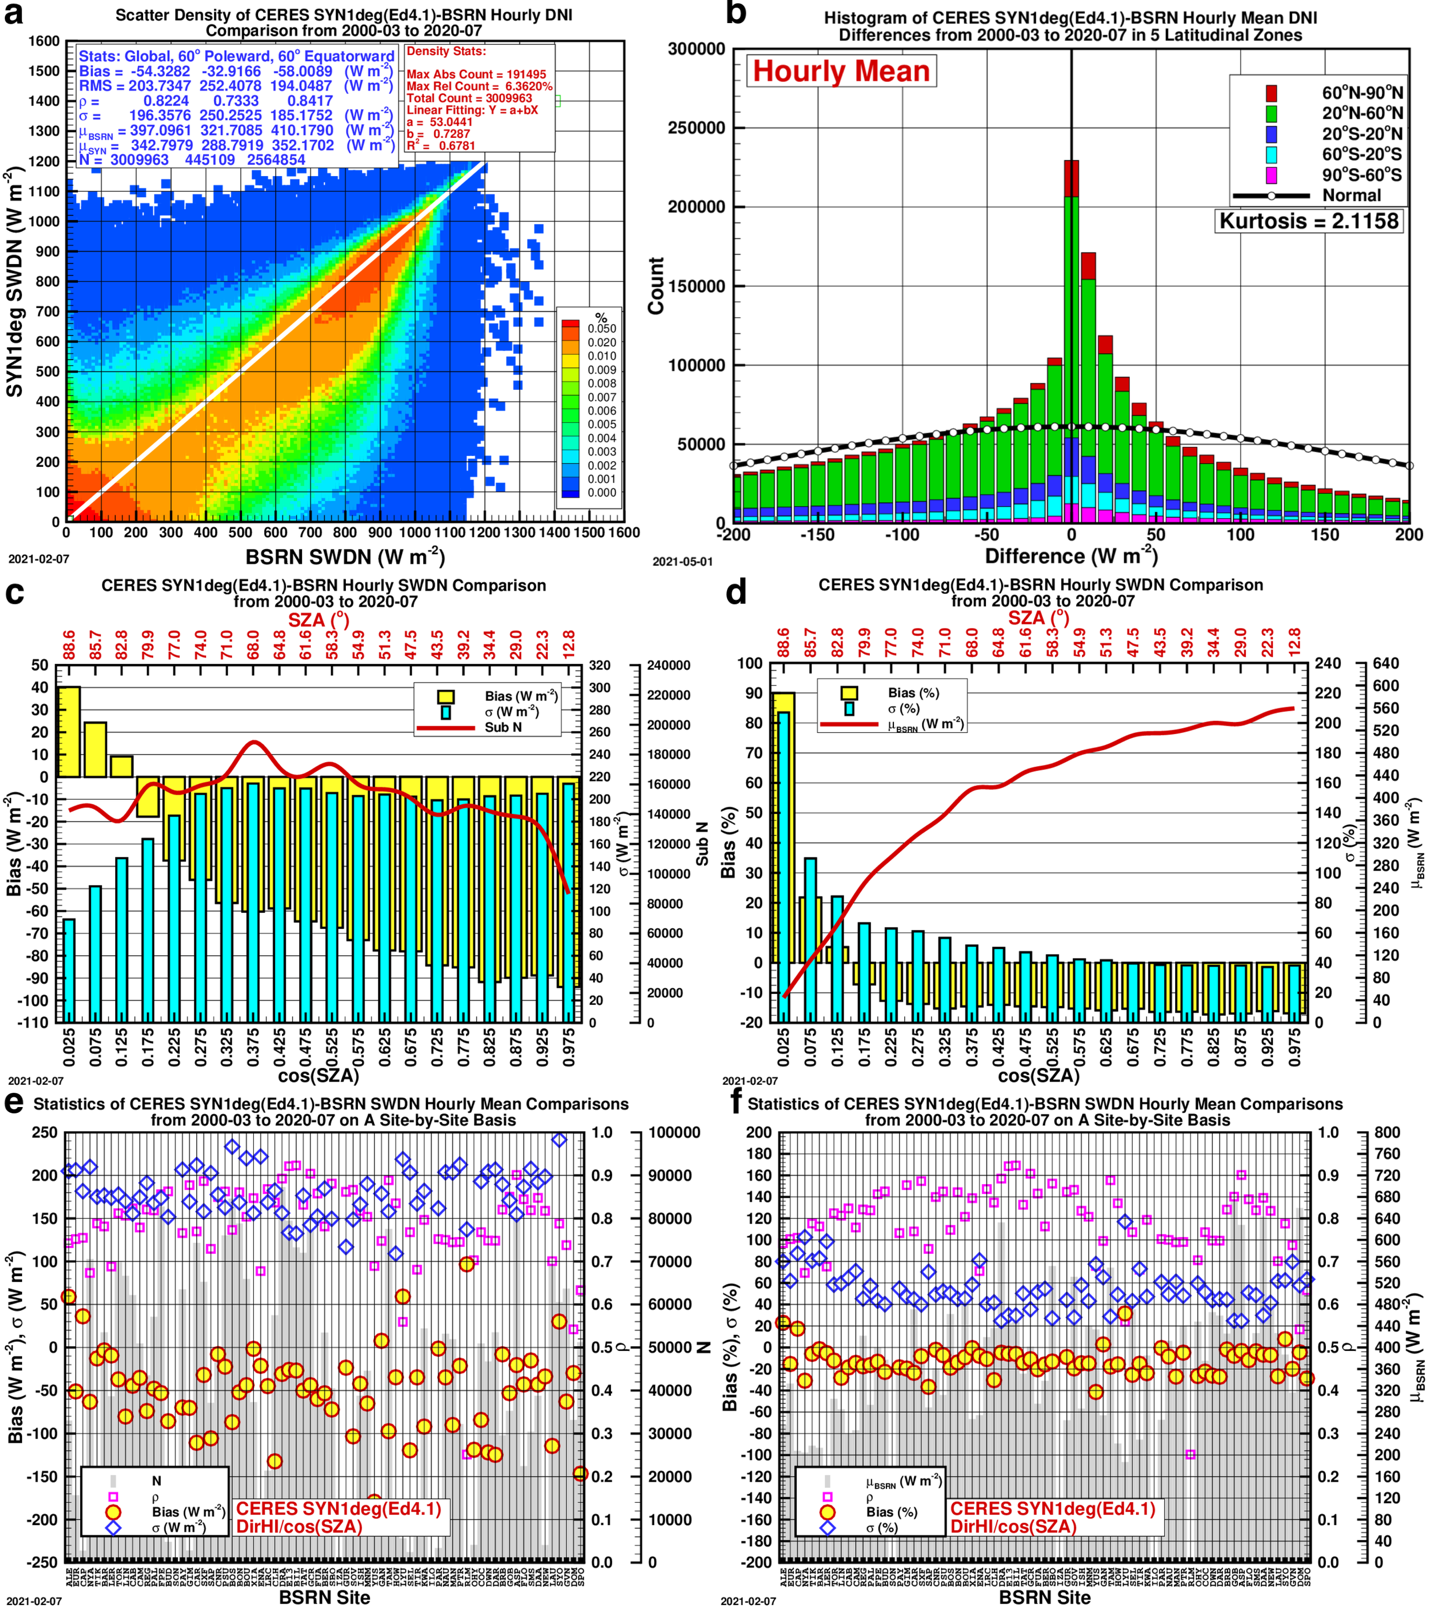
The unambiguous near-linear pattern of the biases of DHI and DirHI in the bins of cos(Z) suggest that the biases are not just stochastic, but might be systemic, or deterministic. In addition, although the overall bias of DNI is considerable, the \sigma, or standard deviation, that represents the uncertainty of DNI, is still appreciably smaller than the DNI from the DirIndex model. These facts suggest that a simple bias-based adjustment can produce a set of DNI with an uncertainty smaller than that from the DirIndex model.
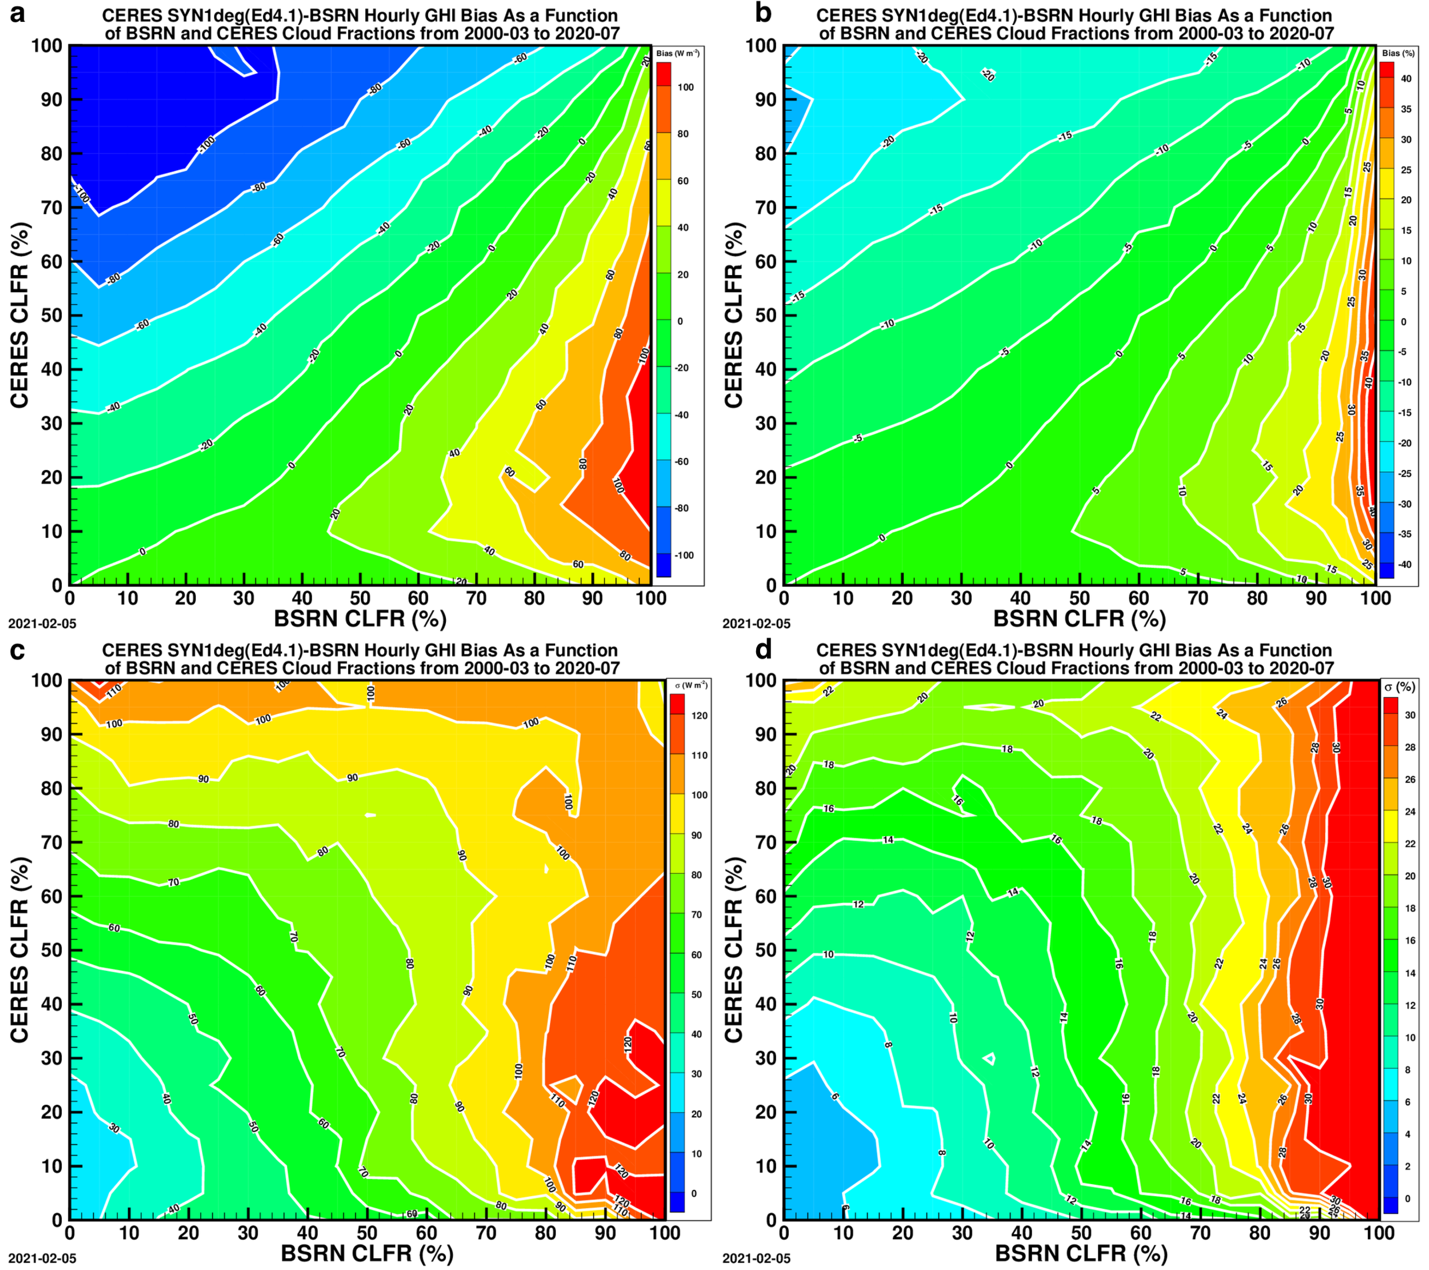
Due to the differences in modus operandi of the ground and satellite-based observations, the BSRN CLoud FRaction (CLFR) and CERES CLFR are often different. Figure 5 shows GHI bias and \sigma on absolute and relative scales in phase space of the BSRN CLFR and CERES CLFR.
Cloud Fraction Comparison: Initial CERES SYN1deg (Ed4.1) to BSRN Data
The bias and \sigma of the initial CERES SYN1deg(Ed4.1) to BSRN hourly GHI as functions of the BSRN and CERES CLFR from 2000-03 to 2020-07.
- A & B — Contour Plots: The bias on absolute and relative scale, respectively.
- C & D — Contour Plots: The standard deviation (\sigma) on absolute and relative scale, respectively.
The relative scale here means that the bias or \sigma is expressed as percentage of the mean BSRN hourly GHI.
Adjustment Version
The bias-based adjustment scheme is as follows: 1) Apply the bias-based adjustment to the DHI and GHI as well; 2) Subtract the DHI from the GHI to get an adjusted version of DirHI; 3) Divide the DirHI by cos(Z) to get DNI. Note that the hourly solar zenith angle, Z, is part of the CERES SYN1deg (Ed4.1) data, and it is determined such that the top-of-atmosphere (TOA) DirHI divided by the cos(Z) is equal to the solar constant.
To perform the adjustment of DHI, the CERES SYN1deg-BSRN hourly DHI biases are first calculated in 100 bins of cos(Z), as opposed to 20 bins in Figures 1-4. In each bin, the bias is calculated on the absolute scale, Bias, in W m-2, and on relative scale, R_{Bias} as percentage of the mean SYN1deg (Ed4.1) hourly DHI, as opposed to the BSRN hourly mean DHI, the bias is considered to represent the center of the bin. Now both Bias and R_{Bias} are functions of cos(Z). For any given hourly DHI, I_{DH}, its corresponding cos(Z) is first used to determine its bias through linear interpolation; if the Bias or R_{Bias} is negative, then the adjusted DHI, I_{DH}^c=I_{DH}-Bias; if the Bias or R_{Bias} is positive, then the adjusted DHI, I_{DH}^c=I_{DH}·(1-R_{Bias}). The scheme keeps or reduces the random variability of the initial data.
The adjustment of GHI is similarly performed. The difference between the adjusted GHI and adjusted DHI is the adjusted DirHI.
Modification of cos(Z)
Effective hourly solar zenith angle that correctly relates hourly direct horizontal irradiance and hourly direct normal irradiance has been studied 6, and the CERES hourly solar zenith angle, Z, which is based on the relation between the hourly DirHI and DNI, or solar constant, at TOA, is one of the six methods studied. According to the study, the best result is based on a surface clear-sky model that computes clear-sky hourly DirHI and DNI.
Here, however, we will only modify the cos(Z) by adding a linear component for large Z values to prevent cos(Z) from getting too small. When Z>75°, the value cos(Z) approaches 0 infinitesimally as the DirHI also approaches 0 and, and the error becomes a more and more significant part of the DirHI value. Consequently, the derived DNI, or DirHI/cos(Z) becomes haphazardly, or unphysically, large. The following adjustment of cos(Z) for Z>75° is proposed.
Let μ stand for cos(Z), and μ_{eff} for effective cos(SZA). If Z≤75°, then μ_{eff}=μ; if Z>75°, then μ_{eff}=μ+μ_{A}, where μ_{A}=-k/μ_{75d} μ+k, μ_{75d}=cos(75°), and k is an adjustable parameter, and when k=0.045, the biases are minimized for Z>75°. In fact, the biases in all twenty 0.05-sized bins become one digit.
Results
The POWER Project needs GHI, DHI and, in particular, DNI. The CERES SYN1deg (Ed4.1) has hourly GHI and DHI, but not DNI, and instead, it has DirHI. However, it has been found that the DHI is positively biased against BSRN and, the DirHI is negatively biased against BSRN, and the biases become more and more pronounced as cos(Z) increases. Consequently, the derived DNI, or DirHI/cos(Z), is also negatively biased. In addition, the cos(Z) value approaches 0 infinitesimally toward sunset, and the derived DNI becomes haphazardly and unphysically large. Therefore, we performed a bias-based adjustment of the GHI and DHI, and use their difference, GHI-DHI as adjusted DirHI, and the cos(Z) is modified by adding a linear component to cos(Z) when Z>75°.
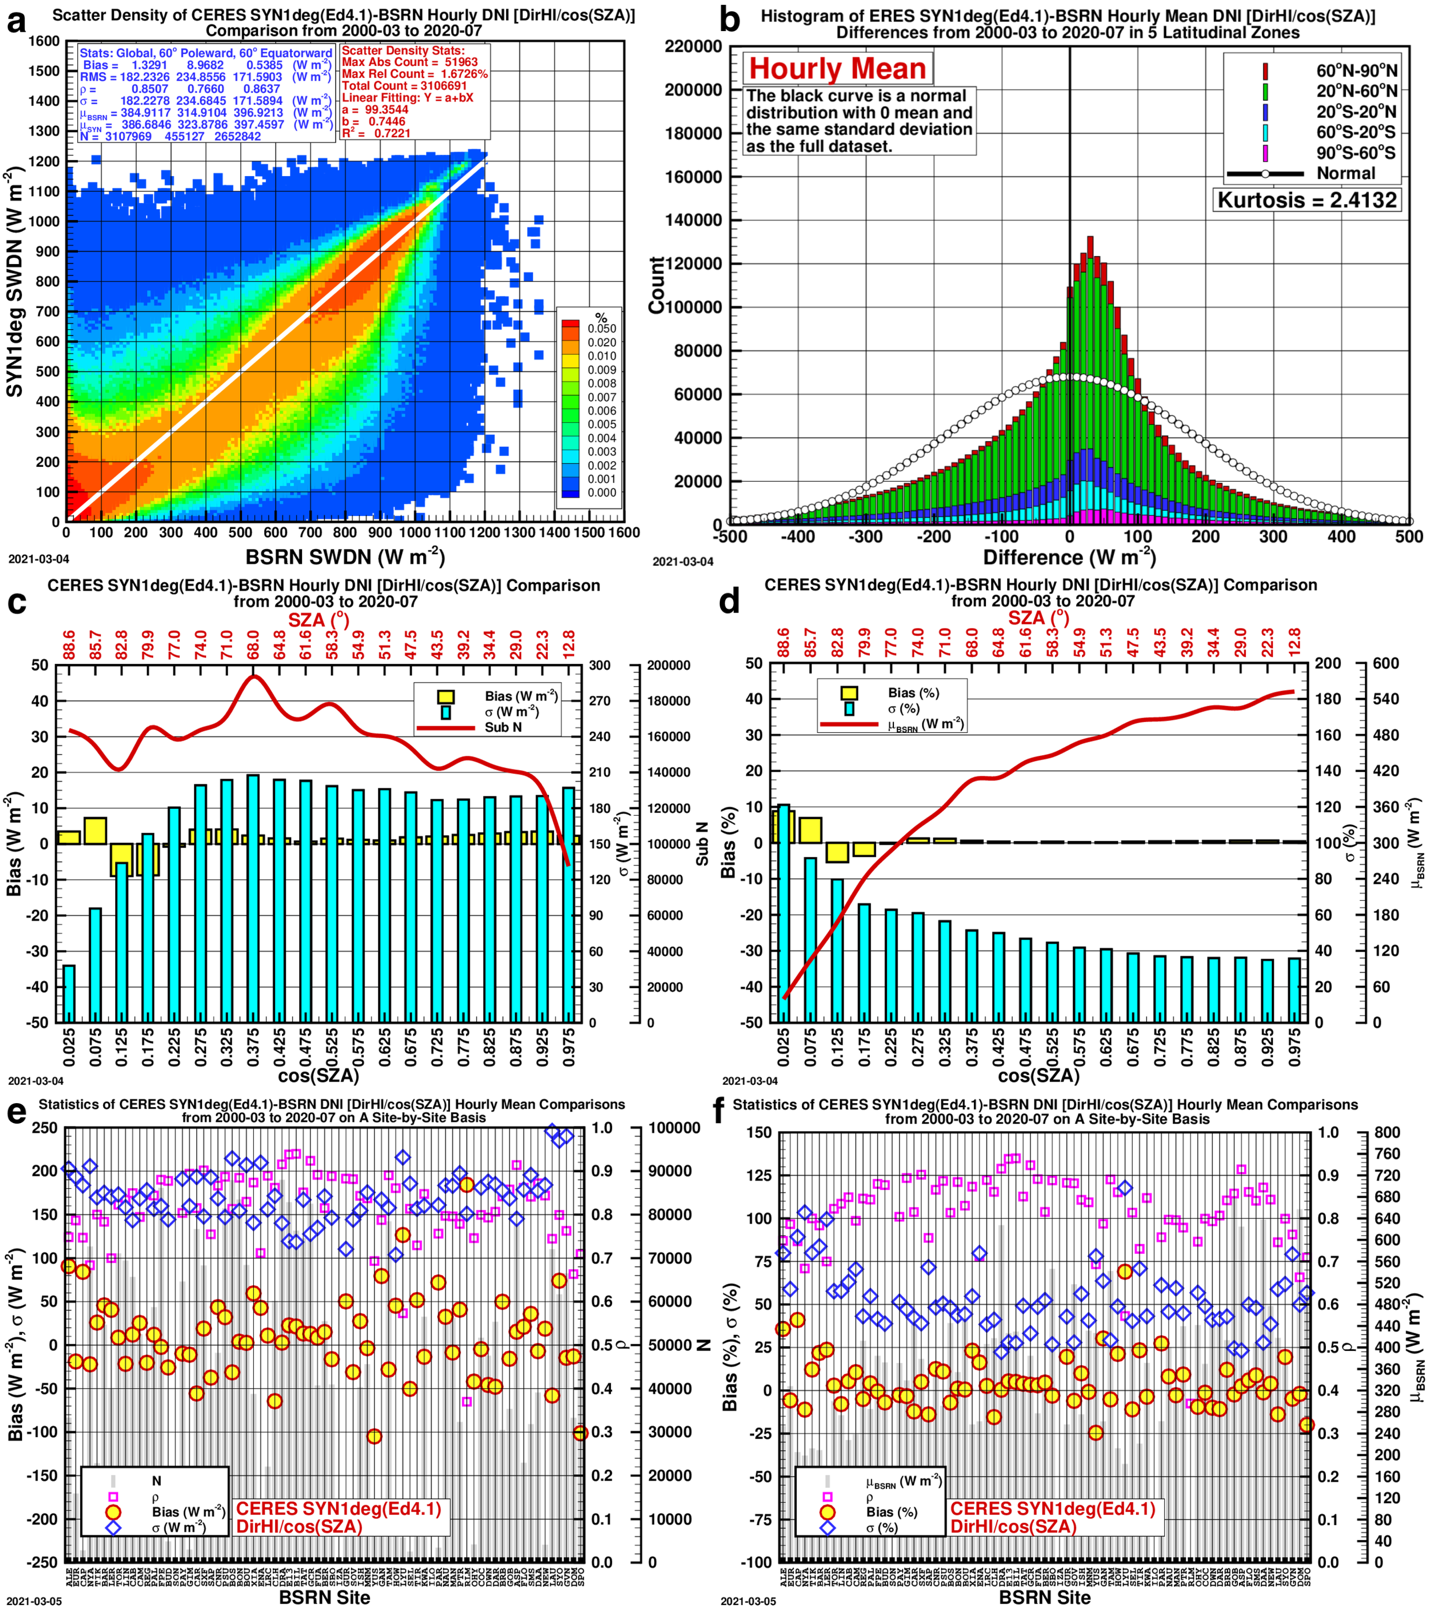
Comparison Plots: Adjusted CERES SYN1deg (Ed4.1) to BSRN Data
The comparison plots for the comparison of the Adjusted CERES SYN1deg (Ed4.1) hourly with the BSRN data for all-sky GHI, DHI, DirHI and DNI from 2000-03 to 2020-07 before and after the adjustment.
- A — Scatter Density Plot: The statistics shown are categorized as “Global” that includes all data points, “60° Poleward” and “60° Equatorward”; \rho stands for correlation coefficient, \sigma standard deviation, \muBSRN the BSRN mean, and N the total number of data points.
- B — Histogram of Differences: Histogram of the SYN1deg (Ed4.1)-BSRN hourly GHI differences.
- C & D — Bar Graphs of Bias: The biases in 20 bins of cos(Z) on absolute and relative scale, respectively.
- E & F — Scatter Plots of Bias by Site: The bias, \sigma and \rho on a site-by-site basis.
Summary Statistics: CERES SYN1deg (Ed4.1) to BSRN Data
The summary statistics tables for the comparison of the initial CERES SYN1deg (Ed4.1) hourly with the BSRN data for all-sky GHI, DHI, DirHI and DNI from 2000-03 to 2020-07 before and after the adjustment.
Rows:
- Before: The biases in W m-2 of the data prior to the adjustment.
- After: The biases in W m-2 of the data once the adjustment has been implemented.
| Bias | RMS | ρ | \sigma | μSYN | N | |
|---|---|---|---|---|---|---|
| Before | -2.91 | 83.49 | 0.957 | 83.44 | 341.6 | 3,331,148 |
| After | 0.01 | 83.19 | 0.957 | 83.19 | 344.5 | 3,331,148 |
| Bias | RMS | ρ | \sigma | μSYN | N | |
|---|---|---|---|---|---|---|
| Before | 30.58 | 85.86 | 0.831 | 80.23 | 168.3 | 3,450,473 |
| After | 0.01 | 65.70 | 0.830 | 65.70 | 137.9 | 3,450,473 |
| Bias | RMS | ρ | \sigma | μSYN | N | |
|---|---|---|---|---|---|---|
| Before | -37.10 | 122.20 | 0.888 | 116.48 | 192.6 | 3,009,959 |
| After | -0.02 | 106.50 | 0.906 | 106.50 | 222.6 | 3,107,945 |
| Bias | RMS | ρ | \sigma | μSYN | N | |
|---|---|---|---|---|---|---|
| Before | -54.30 | 203.70 | 0.822 | 196.35 | 342.8 | 3,009,963 |
| After | 0.72 | 182.20 | 0.851 | 182.20 | 386.1 | 3,107,969 |
| DirIndex Model | 8.54 | 228.80 | 0.758 | 228.65 | 444.9 | 2,195,000 |
^The DNI from the DirIndex model covers the period from 2000-04 to 2016-12 only.
The adjusted DNI shows an overall minimal bias, and in all the 20 bins of cos(Z), the biases are all 1-digit on both the absolute and relative scales. More importantly, the overall standard deviation of the differences, or uncertainty, is significantly smaller than that of the DNI computed using the DirIndex model.
-
Baseline Surface Radiation Network (BSRN/WCRP): New Precision Radiometry for Climate Research. B. Am. Meteorol. Soc., 79(10), 2115-2136. ↩
-
Zhang, T., Stackhouse, Jr., P.W., Chandler, W.S., and Westberg, D.J., 2014. Application of a global-to-beam irradiance model to the NASA GEWEX SRB dataset: An extension of the NASA Surface meteorology and Solar Energy datasets. Sol. Energy, 110, 117-131. ↩
-
Ineichen, P., 2008. Comparison and validation of three global-to-beam irradiance models against ground measurements. Sol. Energy, 82, 501-512. ↩
-
Gueymard, C.A., and Ruiz-Arias, J.A., 2016. Extensive worldwide validation and climate sensitivity analysis of direct irradiance predictions from 1-min global irradiance. Sol. Energy, 128, 1-30. ↩
-
Zhang, T., Stackhouse, Jr., P.W., and Westberg, D.J., 2017. The NASA POWER SSE: Deriving the direct normal counterpart from the CERES SYN1deg hourly global horizontal irradiance during early 2000 to near present. AGU 2019 Fall Meeting, New Orleans. ↩
-
Blanc, P. and Wald, L., 2016. On the effective solar zenith and azimuth angles to use with measurements of hourly irradiation. Adv. Sci. Res., 1, 1-6. ↩