Meteorological
Meteorological parameters are derived from NASA's GMAO MERRA-2 assimilation model and GEOS-IT. MERRA-2 is a version of NASA's Goddard Earth Observing System (GEOS) Data Assimilation System (Gelaro, 2017) MERRA-2 is the first long-term global reanalysis to assimilate space-based aerosol observations and uses the GEOS-5 atmospheric model and Gridpoint Statistical Interpolation analysis. Molod, 2015. GMAO GEOS-IT has the same grid resolution as MERRA-2 (and the same model physics less selected observations and surface rain gauge normalized precipitation). GEOS-IT is GMAO's near-real-time instrument-team product that shares the GEOS modeling and assimilation framework, enabling low-latency continuation of the MERRA-2 record. The POWER team processes GEOS-IT data on a daily basis, and it is appended to the end of the MERRA-2 daily time series to provide low latency products, which are generally ready within about two days of real-time. The MERRA-2 values in the resulting daily time series are typically updated every several months. The POWER project provides data at the native source resolutions from the data providers. The primary meteorological data source is ½° latitude by ⅝° longitude grid from GMAO MERRA-2. As data becomes available from providers, it is processed and made available through POWER's services suite.
| Source | Temporal Start | Temporal End | Latency |
|---|---|---|---|
| GMAO MERRA-2 | January 1, 1981 | Month Behind Near Real Time | |
| GEOS-IT | End of MERRA-2 | Near Real Time | 2 Days |
Warning
The time series of daily meteorological data will include MERRA-2 or GEOS-IT data within a few months of Near Real Time; accordingly, it is recommended to end the analysis 2 months behind NRT when assessing climate trends.
MERRA-2
The POWER meteorological parameters provided by the project and listed within this validation section are based on NASA Goddard's Global Modeling and Assimilation Office (GMAO) assimilation model and the Modern Era Retrospective-Analysis for Research and Applications (MERRA-2) (see these for more details on the reanalysis: Gelaro, 2017, Rienecker et al., 2008, Molod et al., 2015, and the MERRA-2 AMS Collection). MERRA-2 spans 1980 to the present and is documented in the peer-reviewed system overview and the GEOS-5 model description, which together establish the reanalysis configuration POWER relies upon. Each of the parameters is either obtained directly from or calculated using meteorological parameters taken from NASA's MERRA-2 assimilation model.
The model seeks to assimilate and optimize observational data and model estimates of atmospheric variables. Types of observations used in the analysis include (1) land surface observations of surface pressure; (2) ocean surface observations of sea level pressure and winds; (3) sea level winds inferred from backscatter returns from space-borne radars; (4) conventional upper-air data from rawinsondes (e.g., height, temperature, wind, and moisture); (5) additional sources of upper-air data include dropsondes, pilot balloons, and aircraft winds; and (6) remotely sensed information from satellites (e.g., height and moisture profiles, total precipitable water, and single level cloud motion vector winds obtained from geostationary satellite images). Emerging from MERRA-2 are hourly global estimates of the vertical distribution of a range of atmospheric parameters.
Values from MERRA-2 are on a ½° x ⅝° global grid. This is the native horizontal resolution at which GMAO distributes the reanalysis fields. The POWER archived data parameters are transformed from Coordinated Universal Time (UTC) to solar local time (i.e., noon is defined to be solar noon without local time zone definitions considered). The MERRA-2 meteorological data available through POWER encompasses the time period from January 1, 1981, through a few months within near-real-time. Each of the POWER MERRA-2 parameters is provided in a time series of hourly (or larger time scale) values. All of the MERRA-2 parameters represent the average value over the spatial grid. The wind speed is at 2 m, 10 m, and 50 m above the average elevation of the grid and precipitation surface value averaged over the grid. The remaining parameters are taken from the model at 2 m above the average elevation of the grid box. Daily maximum and minimum temperatures are obtained from the 24 hourly temperature values, not an average of those values. All other parameters are based upon averages or sums (i.e., HDD and CDD) of the hourly values.
Validation Overview
The assessment of the accuracy of the MERRA-2 parameters is based upon comparisons with observations from the corresponding parameters reported to the National Center for Environmental Information (NCEI). Hourly assessments are compared against the Integrated Surface Database (ISD), while daily average assessments are compared against the Global Summary of the Day (GSOD). The ISD is NOAA/NCEI's quality-controlled archive of global hourly and synoptic surface observations, and GSOD is derived from ISD as daily summaries, making both authoritative ground-truth references for reanalysis evaluation.
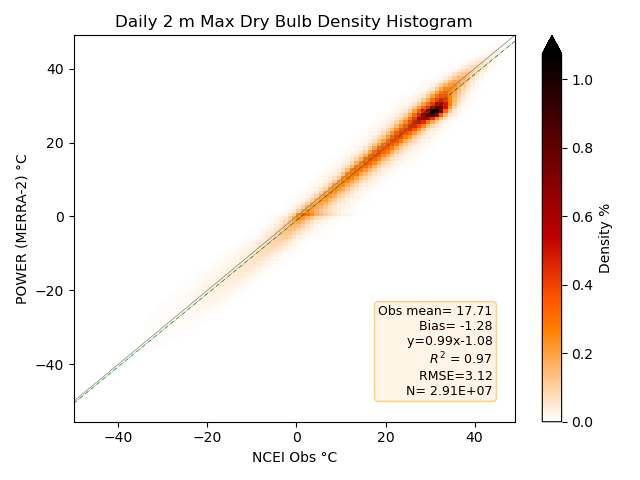
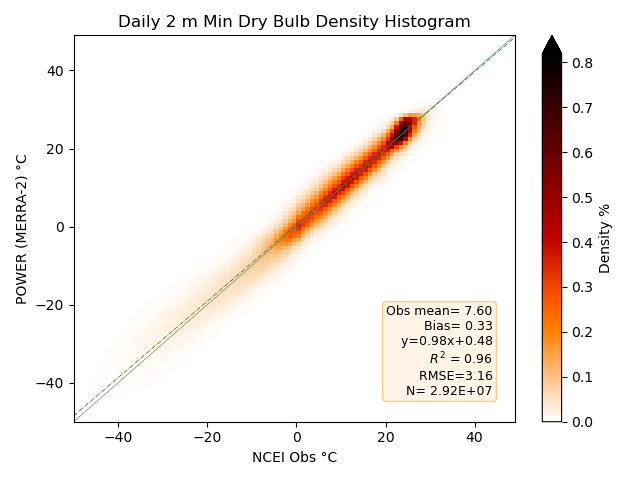
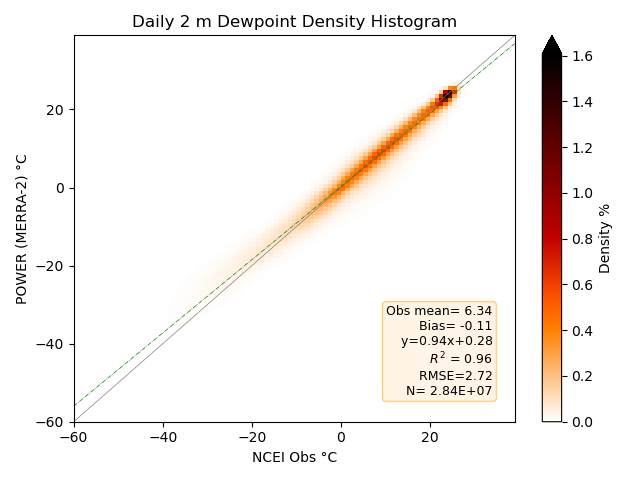
In the following sections, scatter plots associated with each meteorological parameter provide a visual indication of the agreement between the MERRA-2 values and surface observations. The statistical parameters enumerated on each scatter plot and summarized in tables gives a more quantitative assessment of this agreement. These statistics between the model estimates and surface observations include the slope, intercept, and Pearson correlation coefficient associated with a linear least squares regression fit, the Mean Bias Error (MBE), and Root Mean Square Error (RMSE).
Hourly Overview
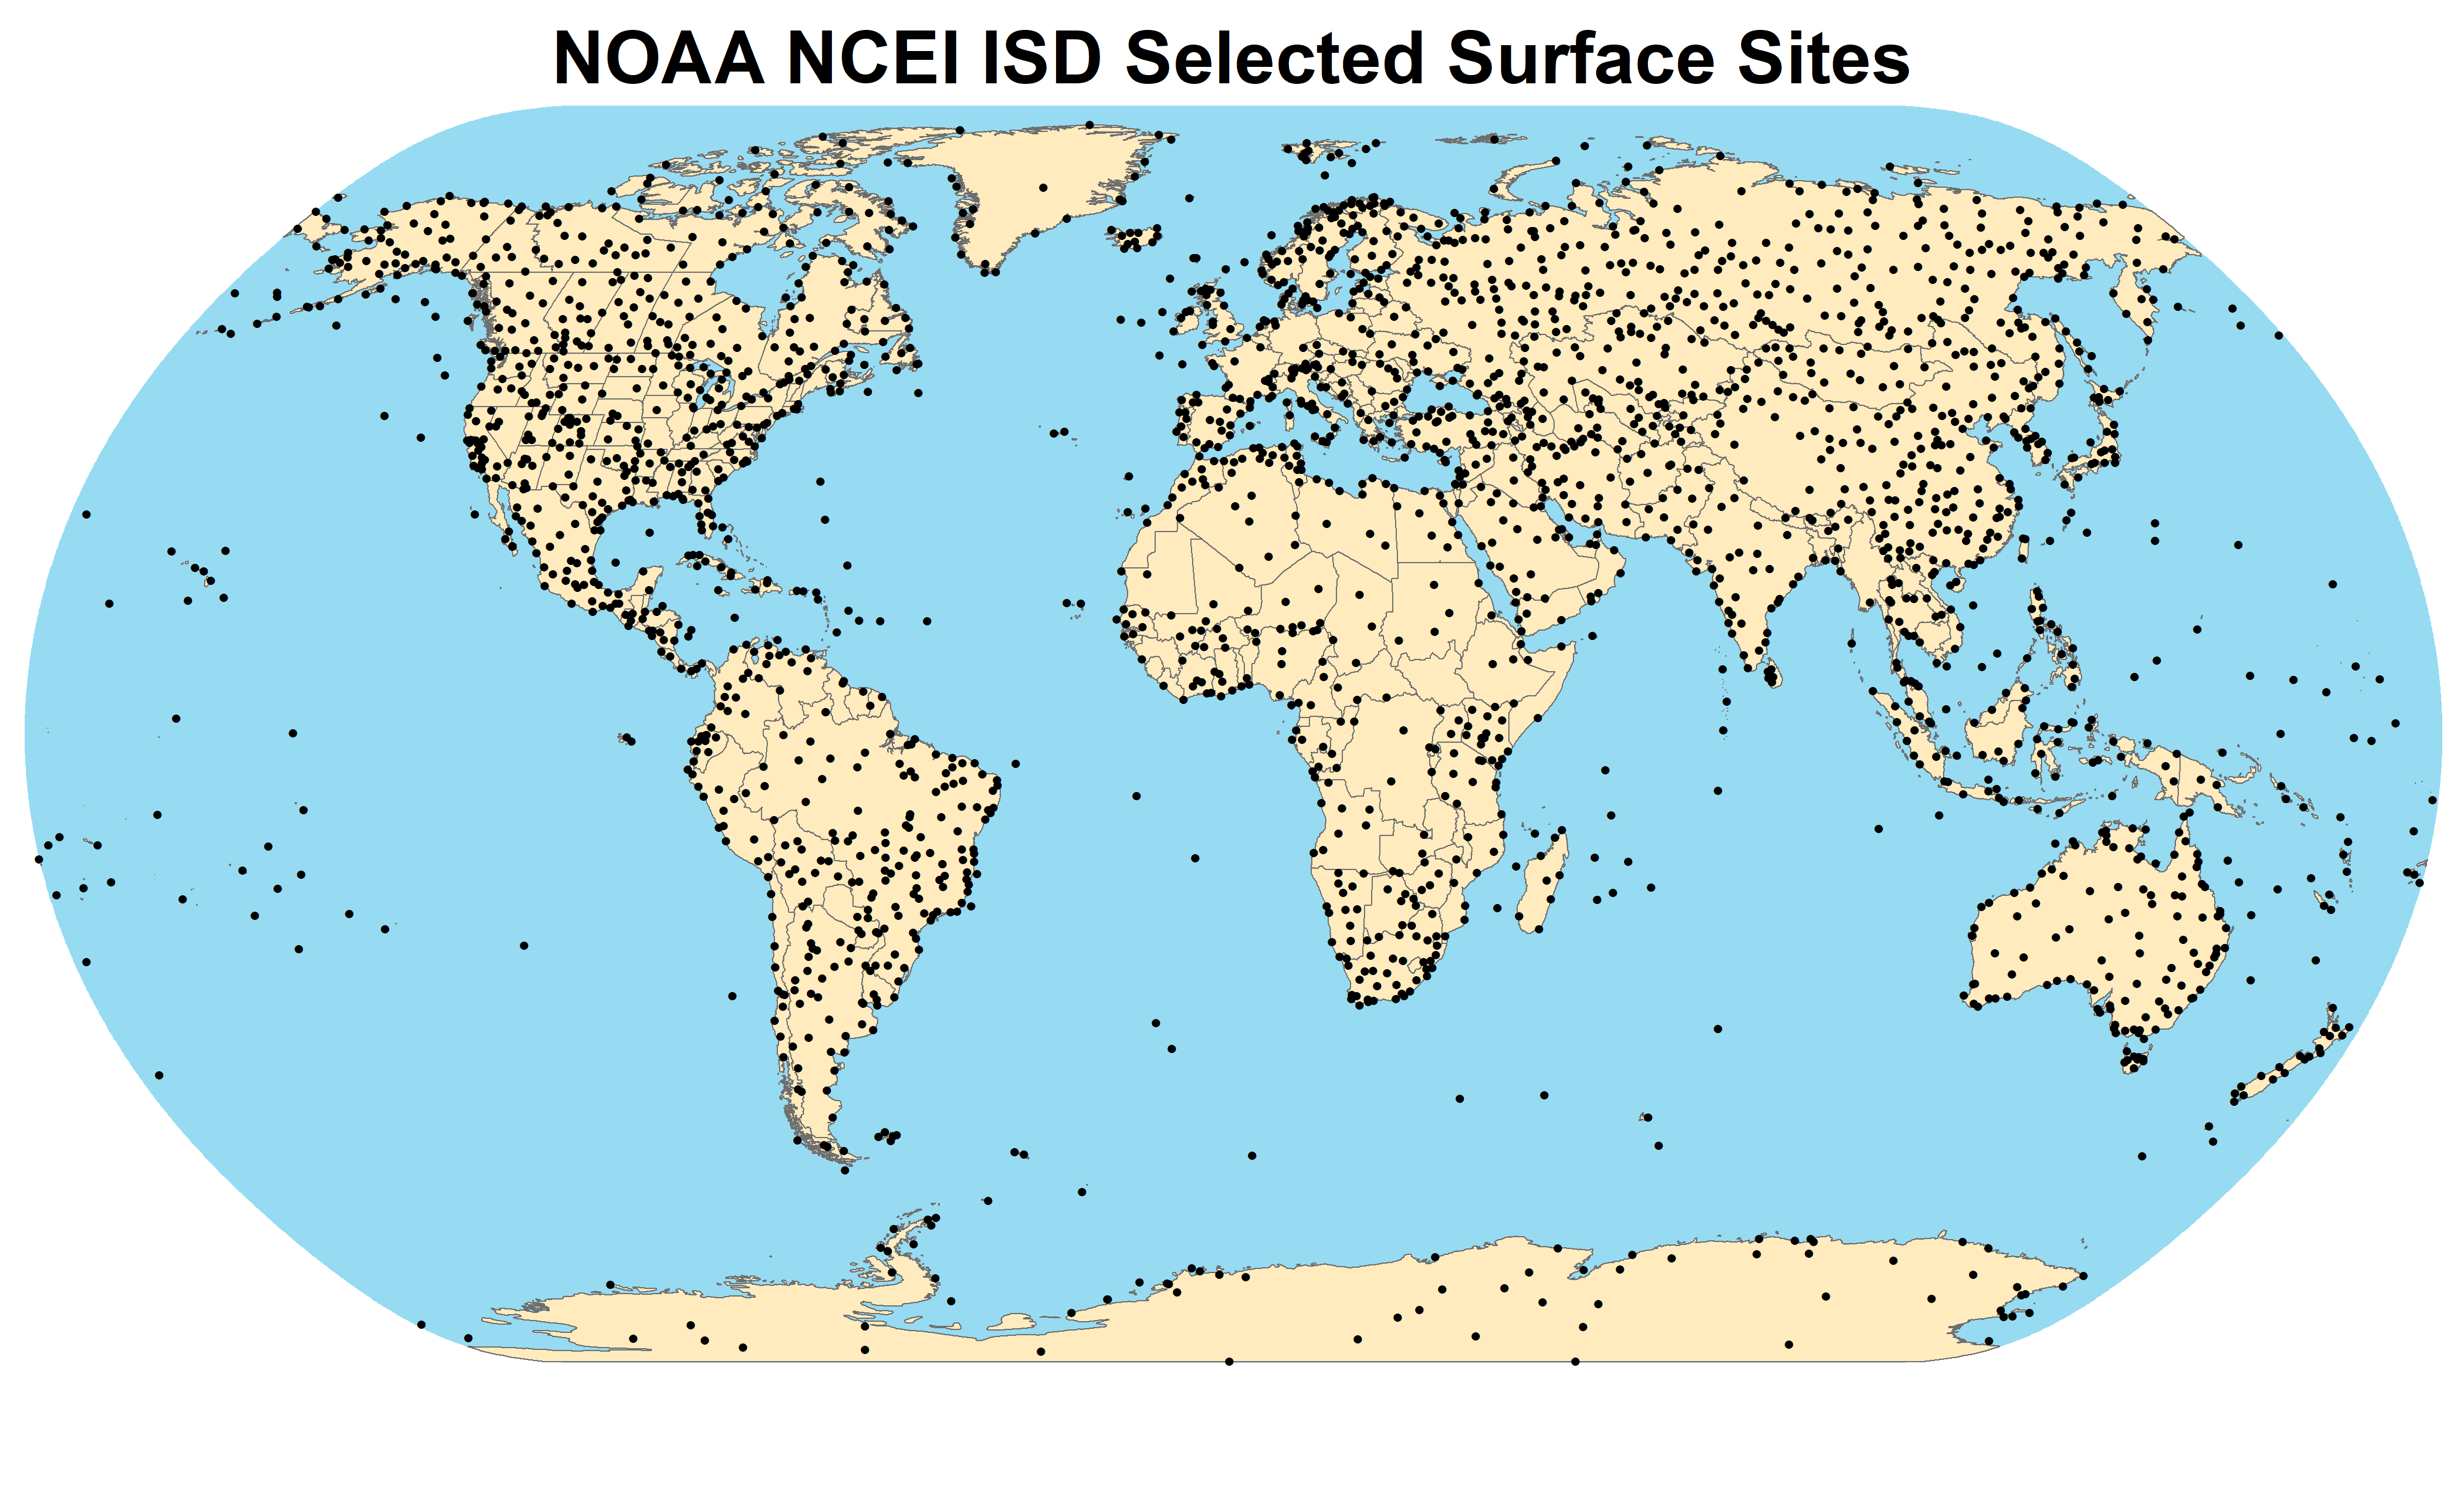
The assessment of the accuracy of the hourly MERRA-2 parameters is based upon the surface observations reported in the NCEI Integrated Surface Database (ISD). After applying quality control codes available with the database to the data, only the reports closest to the top of the hour are retained for potential validation. The next qualification is that there must be a minimum of 2,200 hourly reports in any given year (about 25%) for a site year to be considered. Surface sites are then selected within half-degree grid boxes for each available surface type, (18 total, including forests, shrublands, grass and crop lands, permanent snow or ice, etc.) while also having as much data as possible. This selection process allows for a greater number of surface sites in Africa, South America, Asia, and Eastern Europe to compare against MERRA-2. The years of interest for hourly validation are from 2001–2020. The ISD quality-control flags applied here are defined in the NOAA/NCEI ISD documentation, and the surface-type stratification follows land-cover categories consistent with the GEOS-5 land model.
NCEI ISD Surface Stations
Hourly Surface Validation Summary
Presented here are the results of comparing the original MERRA-2 hourly meteorological parameters to corresponding surface observations from 2,599 stations reported in the NOAA/NCEI Integrated Surface Data files. The Slope, Intercept, and R-squared (Rsqrd) listed in this table are associated with a linear least squares fit of hourly observations at each surface station to the corresponding MERRA-2 values for the overlapping grid cell for 2001–2020. The Mean Bias Error (MBE), Mean Absolute Error (MAE), and Root Mean Square Error (RMSE) represent mean values over the comparison years.
| Parameter | MBE | MAE | RMSE | Slope | Intercept | Rsqrd |
|---|---|---|---|---|---|---|
| Temperature (°C) | -0.58 | 2.40 | 3.32 | 0.99 | -0.48 | 0.96 |
| Dew Point Temperature (°C) | 0.00 | 2.42 | 3.54 | 0.92 | 0.51 | 0.93 |
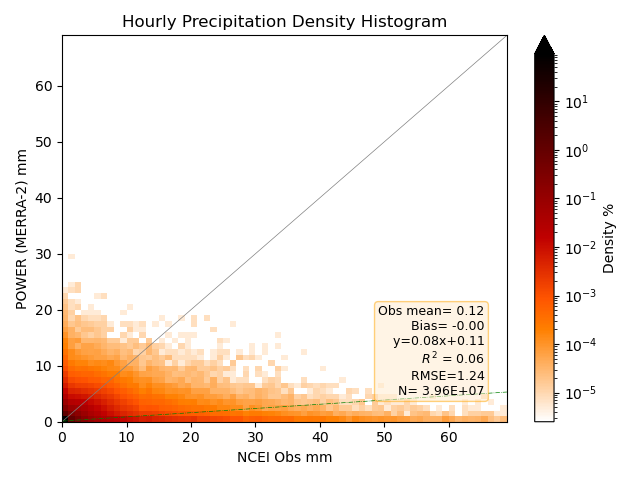
| Precipitation (mm) | 0.00 | 0.16 | 1.24 | 0.08 | 0.11 | 0.06 |
| Elevation Corrected Surface Pressure (hPa) | 0.26 | 1.14 | 2.11 | 0.98 | 15.33 | 1.00 |
| Wind Speed (m/s) | 0.52 | 1.82 | 2.47 | 0.54 | 2.14 | 0.40 |
- The parameters are evaluated at the hourly temporal level.
- The height above the surface over the entire grid box area is 2 m for each parameter, except for the wind which is 10 m.
Daily Average Overview
Comparison statistics for the daily assessment are based upon comparisons of the given parameter for 1981–2020. The same set of sites from the hourly assessment are used here.
Daily Average Surface Validation Summary
Presented here are the results of comparing MERRA-2 daily meteorological parameters to corresponding surface observation reported in the National Center for Environmental Information (NCEI) (formerly National Climatic Data Center) Global Summary of the Day (GSOD) files. The Slope, Intercept, and R-squared (Rsqrd) listed in this table are associated with a linear least squares fit of daily observations at each surface station to the corresponding MERRA-2 values for the overlapping grid cell. The Mean Bias Error (MBE) and Root Mean Square Error (RMSE) represent mean values over the comparison years.
| Parameter | MBE | RMSE | Slope | Intercept | Rsqrd |
|---|---|---|---|---|---|
| Average Temperature (°C) | -0.53 | 2.10 | 1.00 | -0.58 | 0.97 |
| Minimum Temperature (°C) | 0.32 | 3.15 | 0.98 | 0.46 | 0.87 |
| Maximum Temperature (°C) | -1.23 | 3.10 | 0.99 | -1.01 | 0.87 |
| Dew Point Temperature (°C) | 0.21 | 2.34 | 0.95 | 0.51 | 0.95 |
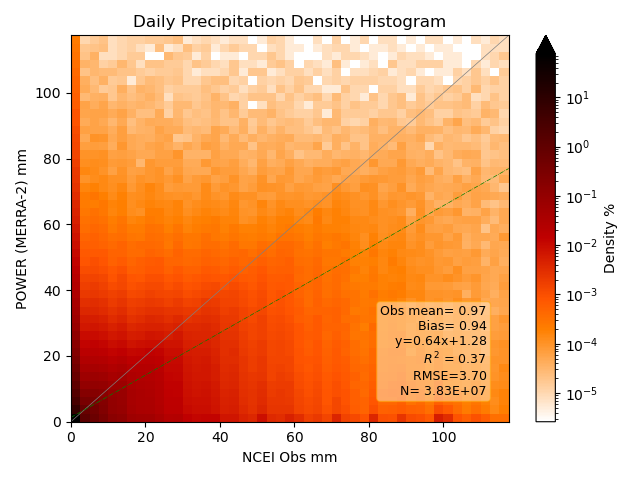
| Precipitation (mm/day) | 0.55 | 3.69 | 0.64 | 1.05 | 0.39 |
| Elevation Corrected Surface Pressure (hPa) | 0.30 | 1.82 | 0.98 | 16.73 | 0.72 |
| Wind Speed (m/s) | 0.33 | 1.45 | 0.79 | 1.09 | 0.60 |
- The height above the surface over the entire grid box area is 2 m for each parameter, except for the wind which is 10 m.
Validation Details
Dry Bulb Temperature (T2M)
This section compares MERRA-2 2-meter air temperature to observations reported to the NCEI.
Hourly Dry Bulb Temperature
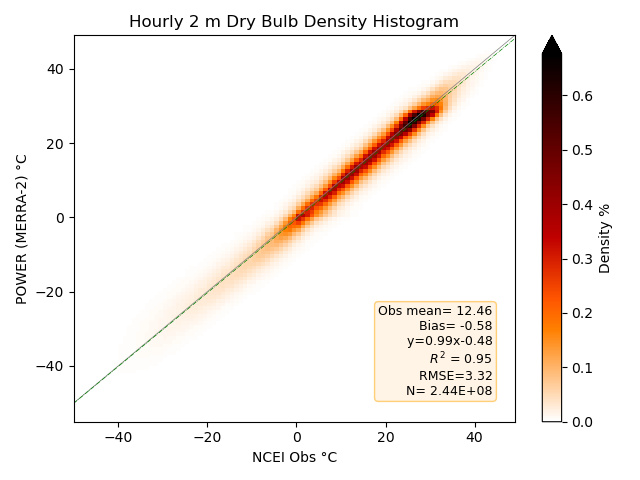
Density plot of the 2-D histograms comparing MERRA-2 hourly temperatures with station observations from the selected NCEI ISD files for the years 2001–2020. Darker reds indicate a higher number of matched pairs within the 2-D histogram.
Daily Average Dry Bulb Temperature
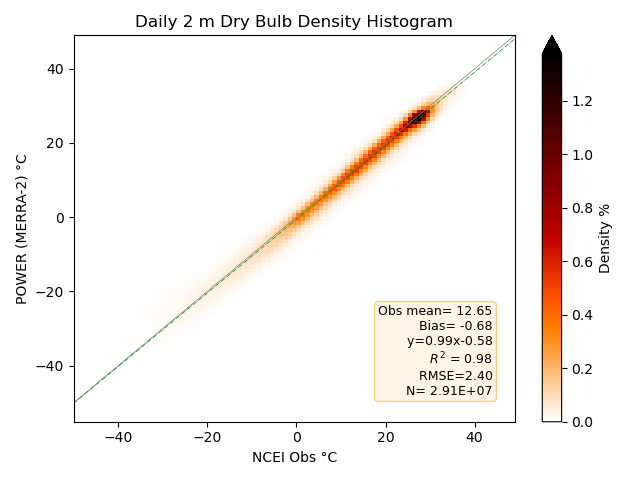
Density plot of the 2-D histograms comparing MERRA-2 daily averaged temperatures with station observations from the NCEI GSOD files for 1981–2020. Darker reds indicate a higher number of matched pairs within the 2-D histogram.
Daily Maximum Dry Bulb Temperature
Density plot of the 2-D histograms comparing MERRA-2 daily maximum temperatures with station observations from the NCEI GSOD files for 1981–2020. Darker reds indicate a higher number of matched pairs within the 2-D histogram.
Daily Minimum Dry Bulb Temperature
Density plot of the 2-D histograms comparing MERRA-2 daily minimum temperatures with station observations from the NCEI GSOD files for 1981–2020. Darker reds indicate a higher number of matched pairs within the 2-D histogram.
Dew Point Temperature
This section compares MERRA-2 2-meter dew point temperature to observations reported to the NCEI.
Hourly Dew Point Temperature
Density plot of the 2-D histograms comparing MERRA-2 hourly dew point temperatures with station observations from the selected NCEI ISD files for the years 2001–2020. Darker reds indicate a higher number of matched pairs within the 2-D histogram.
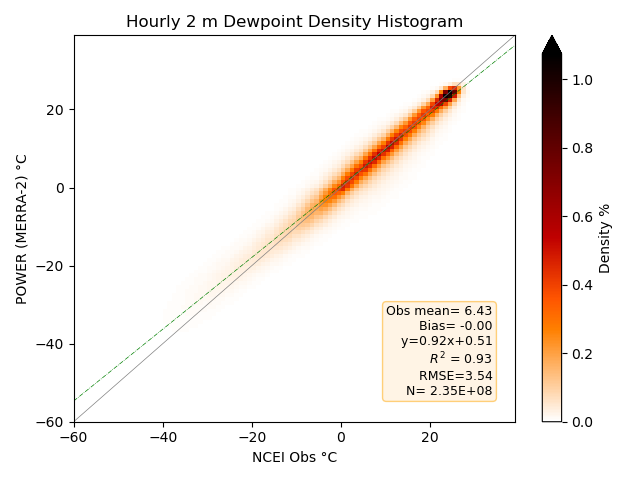
As with the daily average validation, the hourly validation shows good clustering along the 1:1 correlation line.
Daily Average Dew Point Temperature
Density plot of the 2-D histograms comparing MERRA-2 daily averaged dew point temperatures with station observations from the NCEI GSOD files for 1981–2020. Darker reds indicate a higher number of matched pairs within the 2-D histogram.
Precipitation
This section compares MERRA-2 precipitation to observations reported to NCEI. MERRA-2 precipitation over land incorporates an observationally corrected precipitation forcing (PRECTOTCORR vs. PRECTOT in ordering data), which is known to improve agreement with gauge-based records relative to purely model-generated precipitation. (Reichle, et al., 2017)
Hourly Precipitation
Density histogram plot of the MERRA-2 hourly precipitation vs. the hourly station observation values from the selected NCEI ISD files for the years 2001–2023.
Daily Precipitation
Density histogram plot of MERRA-2 daily precipitation vs. the daily station observation values from the NCEI GSOD files for 1981–2023.
Daily Accumulations
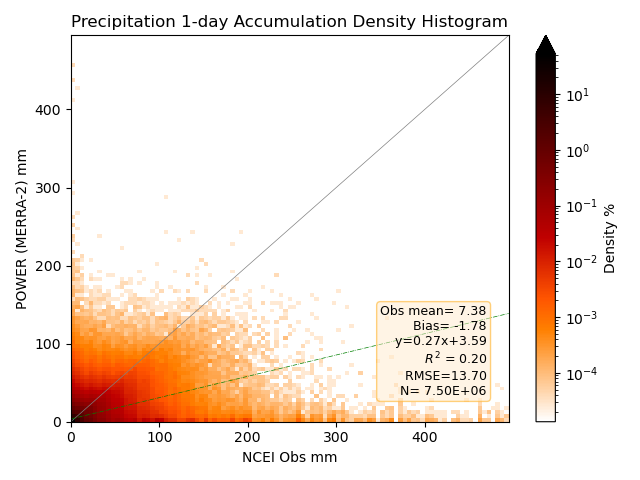
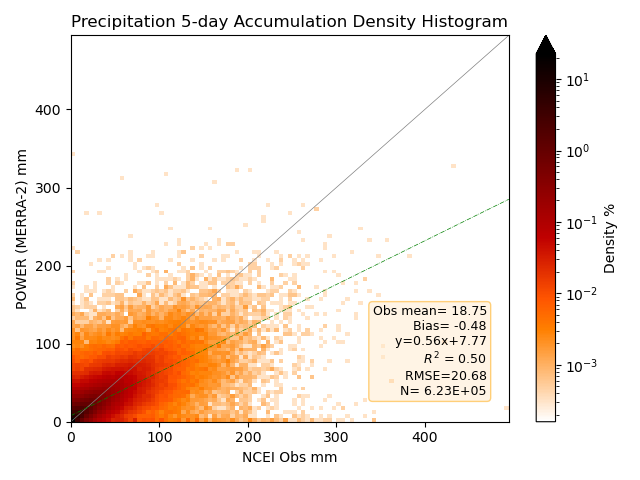
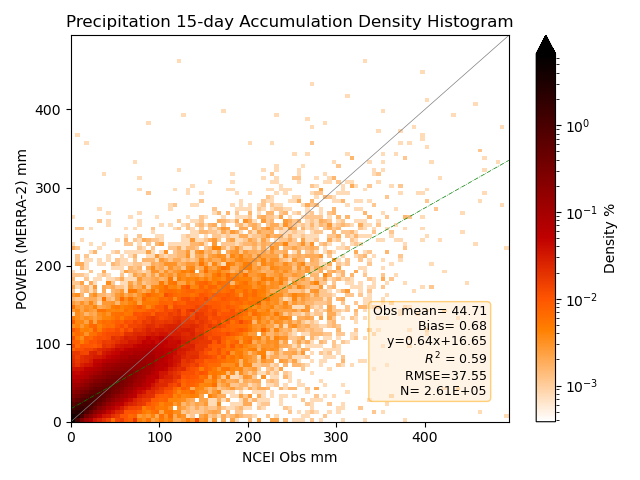
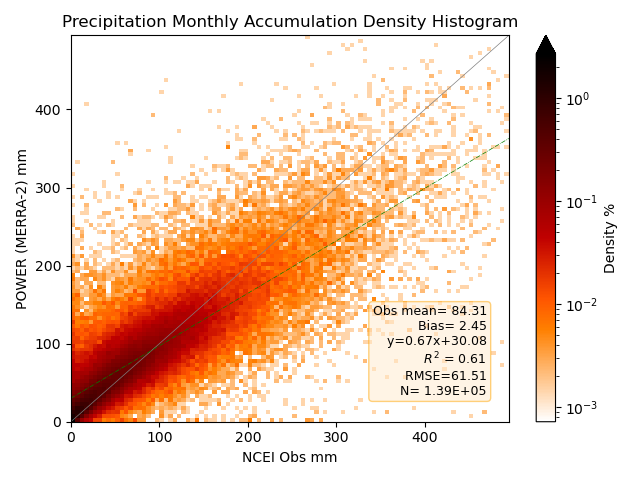
The statistics and density plots below are calculated only when the NCEI observation reports positive precipitation. The density plots are shown with a logarithmic color bar scale to show histogram bins away from the origin.
| Accumulated Days | Site Mean | Slope | Intercept | Rsqrd | Bias | RMSE |
|---|---|---|---|---|---|---|
| 1 | 7.38 | 0.27 | 3.59 | 0.20 | -1.78 | 13.70 |
| 5 | 18.75 | 0.56 | 7.77 | 0.50 | -0.48 | 20.68 |
| 15 | 44.71 | 0.64 | 16.65 | 0.59 | 0.68 | 37.55 |
| Month | 84.31 | 0.67 | 30.08 | 0.61 | 2.45 | 61.51 |
One-Day Accumulated Precipitation
Density histogram plot of MERRA-2 one-day accumulated precipitation vs. the daily station observation values from the NCEI GSOD files for 1981–2023.
Five-Day Accumulated Precipitation
Density histogram plot of the re-gridded MERRA-2 five-day accumulated precipitation vs. the daily station observation values from the NCEI GSOD files for 1981–2023.
15-Day Accumulated Precipitation
Density histogram plot of the re-gridded MERRA-2 15-day accumulated precipitation vs. the daily station observation values from the NCEI GSOD files for 1981–2023.
Monthly Accumulated Precipitation
Density histogram plot of the re-gridded MERRA-2 monthly accumulated precipitation vs. the daily station observation values from the NCEI GSOD files for 1981–2023.
Contingency Table
Many methods exist when it comes to the validation of precipitation (Yates, et al. 2006 Ebert, et al., 2007). Density scatter plots are a useful way to describe and display the validation statistics. Categorical (contingency-table) verification is a standard complement to continuous error metrics for precipitation, because it separates detection skill from amount error. However, days with little or no precipitation dominate the density scatter plots of the precipitation validation due to the random nature of the daily precipitation. Meanwhile, days with heavy precipitation are less frequent. Categorical verification, in this case contingency tables, offer another way to examine the daily precipitation data. The contingency tables below show the cases when the MERRA-2 daily precipitation and ground site daily precipitation:
- Measured no precipitation on the same days ("correct negative").
- Measured precipitation on the same days ("hits"; regardless of amount).
- MERRA-2 measured precipitation while ground site does not ("false alarms").
- MERRA-2 measured no precipitation while ground site did ("misses").
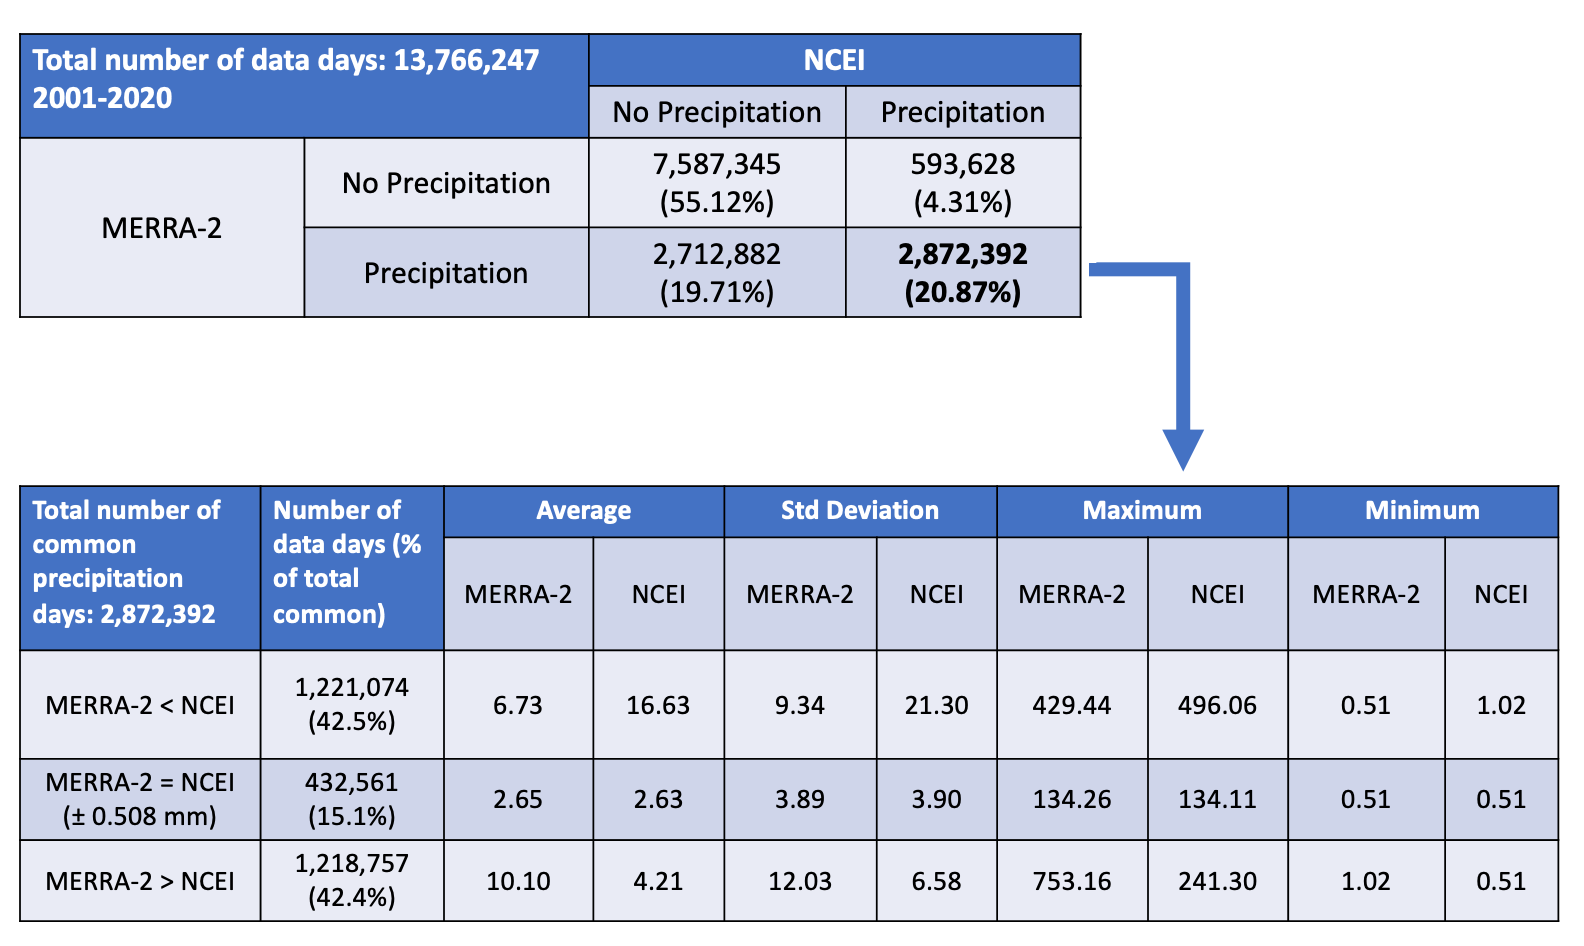
For this contingency table analysis of the MERRA-2 daily precipitation, all the days when the ground site/MERRA-2 data pairs measured a valid precipitation amount above the measurement accuracy of the NCEI ground site instruments (0.508 mm), including days with no precipitation, were counted for the 2001–2020 period. These "data days" total greater than 13.7 million days. The 0.508 mm (0.02 in) threshold reflects the reporting resolution of standard NCEI gauge observations, and the large sample supports stable categorical frequency estimates. The top table in the Hits Contingency Table shows a breakdown of the four categories mentioned previously, with the MERRA-2 data presented by the "rows" on the left side of the table and the NCEI ground site data presented by the "columns" on the top side of the table. Row 1 and Column 1 depict the "No Precipitation" category for the MERRA-2 and NCEI ground site data, respectively. Where Row 1 and Column 1 intersect shows the total number of data days (7,587,345) where both data sets measured less than 0.508 mm on the same days ("correct negative"). This represented 55% of the total data days counted.
Hits: Row 2 and Column 2 depict the "Precipitation" categories for the MERRA-2 and NCEI ground site data, respectively. Their intersection shows the total number of data days (2,872,392) where both data sets measured precipitation greater than 0.508 mm on the same days ("hits"). This represented 21% of the total data days counted. The "hits" category is broken down further in sub-categories, depicted in the lower table in the Hits Contingency Table, along with statistics. The sub-categories consist of data days when the MERRA-2 precipitation is less than the NCEI ground site, when the MERRA-2 precipitation is greater than the NCEI ground site, and when the MERRA-2 precipitation is "equal" to the NCEI ground site. "Equal" meaning within the measurement accuracy of the NCEI ground site instruments (0.508 mm). Out of the total number of data day "hits", 15% data days occur when the MERRA-2 precipitation is equal to the NCEI ground site precipitation. Under equal conditions, MERRA-2 precipitation and NCEI ground site precipitation share similar averages, standard deviations, maximum values, and minimum values. MERRA-2 precipitation is less than the NCEI ground site precipitation on 43% data days out of the total number of data day "hits". As expected, the MERRA-2 precipitation average and standard deviations are roughly 2.5 times less than the NCEI ground site precipitation average and standard deviations. The MERRA-2 precipitation is more than the NCEI ground site precipitation on 42% data days out of the total number of data day "hits". As expected, the MERRA-2 precipitation average and standard deviations are roughly two times more than the NCEI ground site precipitation average and standard deviations.
Hits Contingency Table
Contingency table with focus on the "Hits" category between MERRA-2 precipitation and NCEI GSOD data for 2001–2020.
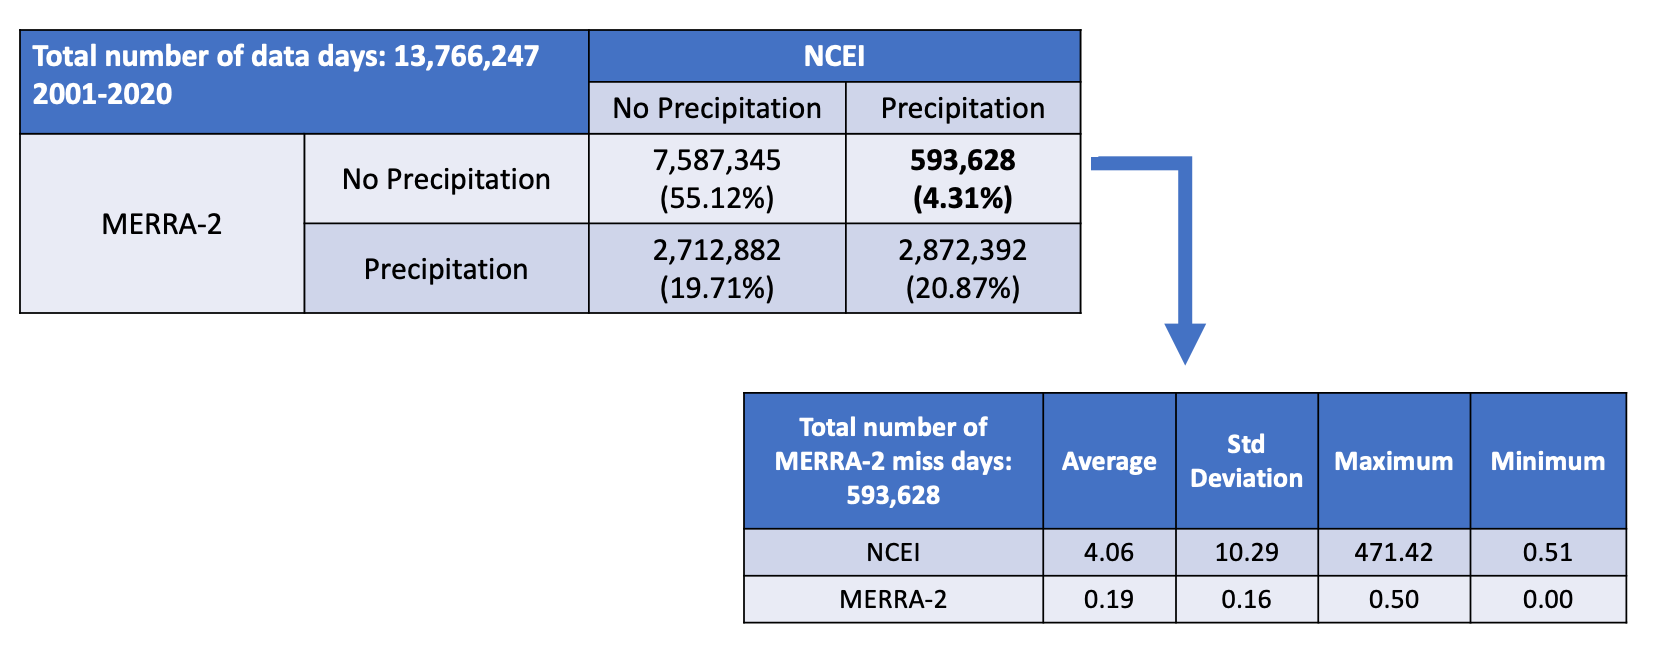
Misses: In the contingency table above, Row 1 and Column 2 depict the "No Precipitation" and "Precipitation" categories for the MERRA-2 and NCEI ground site data, respectively. Their intersection shows the total number of data days (593,628) when the MERRA-2 precipitation data measured no precipitation while the NCEI ground site precipitation data measured precipitation on the same days ("misses"). This represented 4% of the total data days counted. The "misses" category is broken down further, depicted below in the Misses Contingency Table, along with statistics. The tables show the data days when the MERRA-2 precipitation has no precipitation and the NCEI ground site has a precipitation amount greater than the measurement accuracy of the NCEI ground site instruments (0.508 mm). In these cases, the NCEI ground site precipitation has an average of 4.06 mm, a standard deviation of 10.29 mm, a maximum value of 471.42 mm, and a minimum value of 0.51 mm. Also included in the table are the statistics for the site data since the comparisons are based on accuracy amounts.
Misses Contingency Table
Contingency table with focus on the "Misses" category between MERRA-2 precipitation and NCEI GSOD data for 2001–2020.
False Alarms: Row 2 and Column 1 depict the "Precipitation" and "No Precipitation" categories for the MERRA-2 and NCEI ground site data, respectively. Their intersection shows the total number of data days (2,712,882) where the MERRA-2 precipitation data measured precipitation while the NCEI ground site precipitation data measured no precipitation on the same days ("false alarms"). This represented 20% of the total data days counted. The "false alarm" category is depicted in the lower table in the False Alarms Contingency Table, along with statistics. The table shows the data days when the MERRA-2 precipitation measured precipitation and the NCEI ground site measured a precipitation amount less than and equal to the measurement accuracy of the NCEI ground site instruments. In these cases, the MERRA-2 precipitation has an average of 3.52 mm, a standard deviation of 6.32 mm, a maximum value of 702.75 mm.
False Alarms Contingency Table
Contingency table with focus on the "False Alarms" category between MERRA-2 precipitation and NCEI GSOD data for 2001–2020.
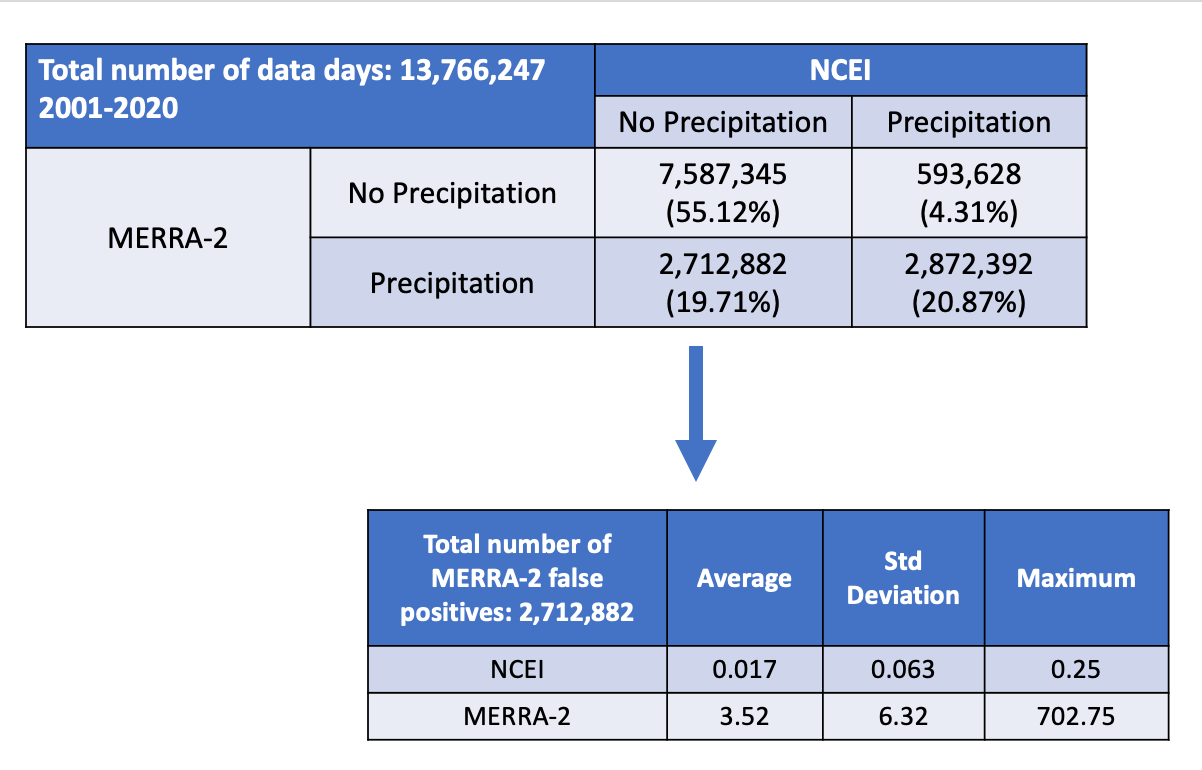
The findings from the contingency tables show additional information not easily seen in the density scatter plots in the Precipitation Overview. On data days when the MERRA-2 precipitation measured no precipitation, it agreed with the NCEI ground site precipitation 55% of the time ("correct negatives") and only disagreed 4% of the time ("misses"). The percentage of "misses" is low compared to the other three categories in the table, with the NCEI ground site precipitation measurement average only being 4 mm. On data days when the MERRA-2 precipitation measured precipitation, the NCEI ground site also measured precipitation 20% of the time ("hits") but disagreed about the same percentage of the time ("false alarms"). On data days when the NCEI ground site measures precipitation, it is encouraging to note MERRA-2 predicts precipitation on the same data days more often than it does not.
Wind
Wind parameters available through the POWER API and DAV include wind speed and direction at various heights above the surface. The user community selection determines the exact height availability. MERRA-2 provides wind components at standard heights (e.g., 2 m, 10 m, and 50 m) from which POWER derives speed and direction.
Mean Wind Speed and Wind Direction Parameters
The wind speed and wind direction parameters are to be used to determine the mean wind flow of a region rather than local area due to effects of buildings and local topography.
Corrected Wind Speed
In addition to the wind speed parameters available at set heights above surface, the POWER API allows the user to request a wind speed at a user defined height (between 10 and 300 m) for a particular surface type. The height adjustment applies a surface-roughness power-law (Hellmann/power-law profile), a widely used engineering approximation for the near-surface wind profile under neutral stability (Peterson, 1978).
Equation: Corrected Wind Speed (Adjusted for Elevation)
| Surface | Definition | Surface | Definition |
|---|---|---|---|
| vegtype_1 | 35 m broadleaf-evergreen trees (70% coverage) | vegtype_7 | 0.6 m perennial ground cover (100%) |
| vegtype_2 | 20 m broadleaf-deciduous trees (75% coverage) | vegtype_8 | 0.5 m broadleaf shrubs (variable %) and ground cover |
| vegtype_3 | 20 m broadleaf and needleleaf trees (75% coverage) | vegtype_9 | 0.5 m broadleaf shrubs (10%) with bare soil |
| vegtype_4 | 17 m needleleaf-evergreen trees (75% coverage) | vegtype_10 | Tundra: 0.6 m trees/shrubs (variable %) and ground cover |
| vegtype_5 | 14 m needleleaf-deciduous trees (50% coverage) | vegtype_11 | Rough bare soil |
| vegtype_6 | Savanna: 18 m broadleaf trees (30%) and ground cover | vegtype_12 | Crop: 20 m broadleaf-deciduous trees (10%) and wheat |
| vegtype_20 | Rough glacial snow/ice | seaice | Smooth sea ice |
| openwater | Open water | airportice | Airport: flat ice/snow |
| airportgrass | Airport: flat rough grass |
Reference
Chandler, William S., C.H. Whitlock, P.W. Stackhouse, Jr., 2005: Determining Wind Resources as a Function of Surface Roughness and Height from NASA Global Assimilation Analysis. Proceedings of the International Solar Energy Society 2005 Solar World Congress, August 6–12, Orlando, Florida
Wind Speed Validation
This section compares MERRA-2 10 m wind speed to observations reported to the NCEI.
Hourly Wind Speed
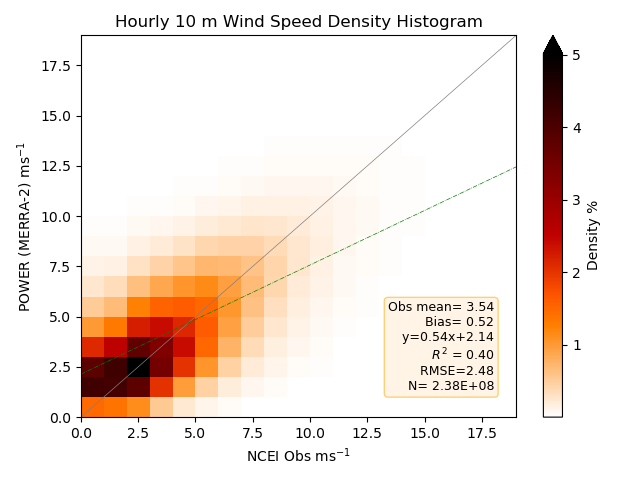
Density plot of the 2-D histograms comparing MERRA-2 hourly 10 m wind speed with station observations from the selected NCEI ISD files for the years 2001–2020. Darker reds indicate a higher number of matched pairs within the 2-D histogram.
Daily Average 10 m Wind Speed
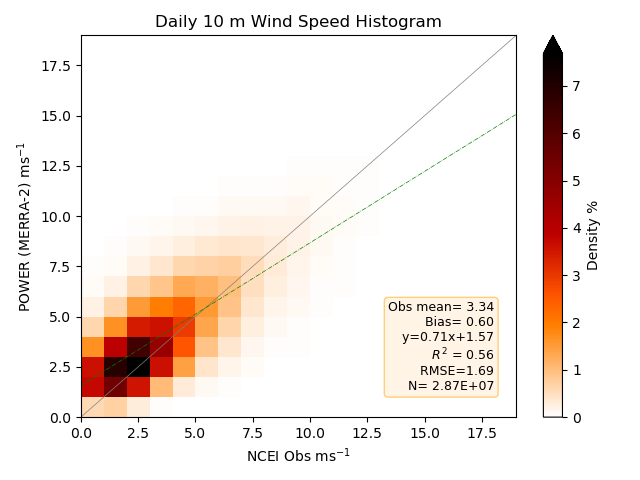
Density plot of the 2-D histograms comparing MERRA-2 daily wind speed with station observations from the NCEI GSOD files for 1981–2020. Darker reds indicate a higher number of matched pairs within the 2-D histogram.
Wind Direction
Wind Direction at a given height in degrees is the meteorological convention. The meteorological convention gives the direction from which the wind originates, and wind direction is measured in degrees clockwise from due north. This convention (0°/360° = north, 90° = east) is the standard adopted by the WMO and NWS for reporting surface and upper-air winds.
Hourly 10 m Wind Direction Contingency Chart
Diagram of the hourly wind direction contingency comparison (shown as percentage) between MERRA-2 10 m wind direction and the selected NCEI ISD files for the years 2001–2019. Hourly wind directions for both are categorized into octads, then 2-D histograms relate the directions to each other. 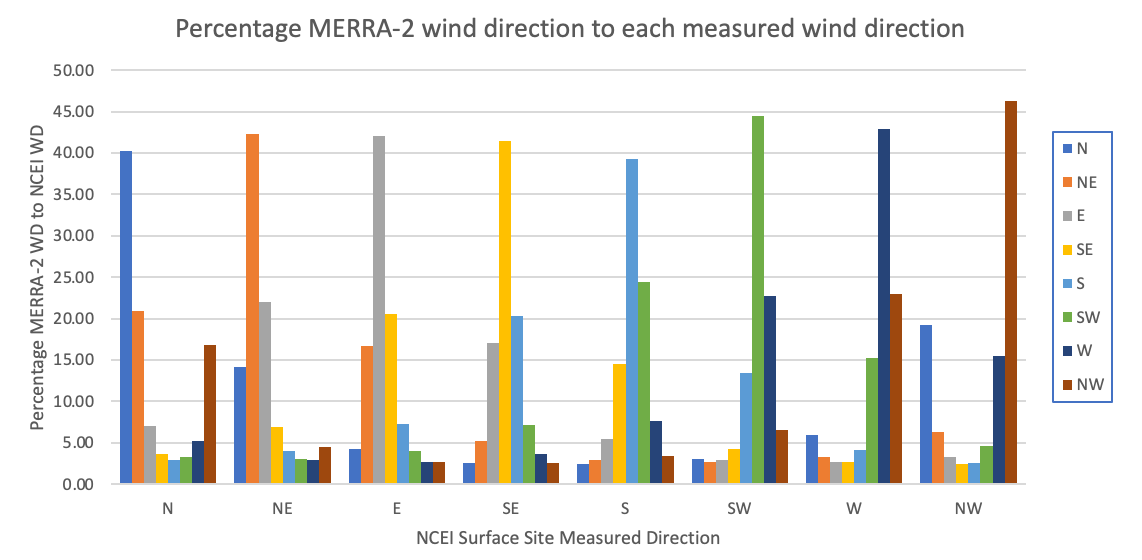
Click to Expand: Python Code
1 2 3 4 5 6 7 8 9 10 11 12 13 14 15 16 17 18 19 20 | |
Surface Pressure
This section compares MERRA-2 surface pressure to observations reported to the NCEI with an adjustment made to the difference in elevation between MERRA-2 and the site elevation. Because the MERRA-2 grid-box elevation generally differs from a station's true elevation, a hypsometric (barometric) reduction is required for a like-for-like comparison; this relation follows directly from hydrostatic balance and the ideal gas law.
Hypsometric Equation for Adjustment of Surface Pressure
The elevation of the MERRA-2 grid box is the mean elevation of the earth’s surface under the grid. In complex terrain one might expect to see a difference between the MERRA-2 elevation and that of the surface site resulting in a difference between the MERRA-2 pressure and that reported by the surface site. The Surface Pressure (Hypsometric Equation) scatter plot illustrates the improvements in the agreement between the MERRA-2 estimates of pressure and observational data by adjusting the MERRA-2 pressure using the hypsometric equation. The hypsometric equation, relates the thickness (h) between two isobaric surfaces to the mean temperature (T) of the layer as:
Solving the hypsometric equation for p1 and substituting the known values for z1, z2, p1, R, and g, gives the adjusted MERRA-2 surface pressure (p1) at the elevation of the NCEI surface site.
Hourly Surface Pressure (Adjusted)
Density plot of the 2-D histograms comparing MERRA-2 hourly adjusted surface pressure with station observations from the selected NCEI ISD files for the years 2001–2020. Darker reds indicate a higher number of matched pairs within the 2-D histogram.
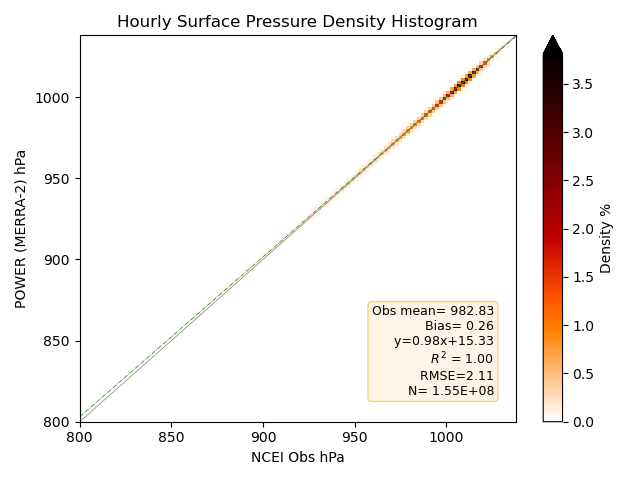
The hourly validation for the adjusted surface pressure shows good agreement with clustering around the 1:1 correlation line, especially for values above 700 hPa.
The daily mean surface pressure is taken directly from the re-gridded MERRA-2 data. It represents estimates of atmospheric pressure at 2 m above the local surface averaged from the original source spatial resolution.
Daily Surface Pressure (Adjusted)
Density plot of the 2-D histograms comparing MERRA-2 daily adjusted surface pressure with station observations from the NCEI GSOD files for 1981–2020. 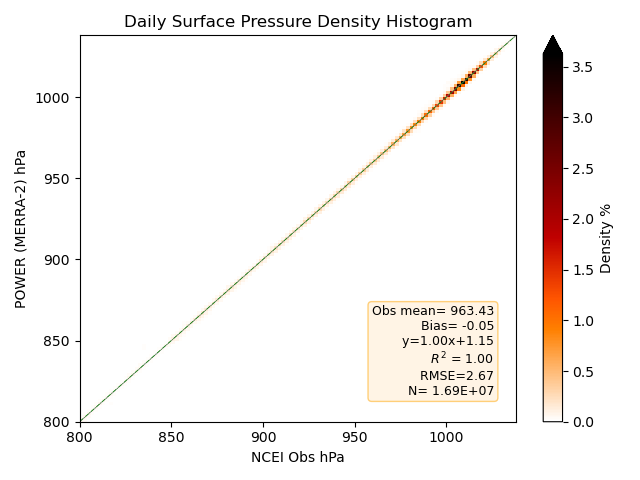
Plot Notes
- The legend on each density plot gives the site observation mean, bias with MERRA-2, root mean squared error (RMSE), equation of the line for the linear least squares fit, coefficient of determination, and number of data pairs to the plotted values.
- The color bar along the right side of the density plot provides a measure of the frequency of the data pairs per bin in plot.
GEOS-IT
In order to provide near-real time meteorological parameters, POWER provides the GMAO's near-real time data set GEOS-IT. More information about GEOS-IT is available at GMAO Products. As MERRA-2 data become available, any GEOS-IT data are over-written within the POWER archive. GEOS-IT is GMAO's operational instrument-team analysis built on the same GEOS atmospheric data assimilation system as MERRA-2, providing a consistent low-latency extension of the record.
Validation Overview
Daily Average Surface Validation Summary With Comparison to MERRA-2
Presented here are the results of comparing 2 years of GEOS-IT and MERRA-2 daily meteorological parameters (2024 and 2025) to corresponding surface observation reported in the NCEI Synoptic Summary of the Day (SSOD) files. The Slope, Intercept, and R-squared (Rsqrd) listed in this table are associated with a linear least squares fit of daily observations at each surface station to the corresponding model values for the overlapping grid cell. The MBE and RMSE represent mean values over the comparison years.
| Parameter | Model | MBE | RMSE | Slope | Intercept | Rsqrd |
|---|---|---|---|---|---|---|
| Average Temperature (°C) | GEOS-IT | -0.26 | 2.08 | 1.00 | -0.26 | 0.98 |
| MERRA-2 | -0.47 | 2.17 | 1.01 | -0.63 | 0.98 | |
| Minimum Temperature (°C) | GEOS-IT | 0.28 | 2.75 | 0.99 | 0.43 | 0.96 |
| MERRA-2 | -0.22 | 2.87 | 1.00 | -0.17 | 0.95 | |
| Maximum Temperature (°C) | GEOS-IT | -0.71 | 2.66 | 1.00 | -0.63 | 0.97 |
| MERRA-2 | -0.54 | 2.70 | 1.01 | -0.69 | 0.96 | |
| Dew Point Temperature (°C) | GEOS-IT | -0.20 | 2.45 | 0.94 | 0.27 | 0.96 |
| MERRA-2 | -0.06 | 2.50 | 0.95 | 0.38 | 0.96 | |
| Precipitation (mm/day) | GEOS-IT | 0.47 | 7.77 | 0.47 | 2.06 | 0.29 |
| MERRA-2 | 0.17 | 7.17 | 0.50 | 1.68 | 0.37 | |
| Wind Speed (m/s) | GEOS-IT | -0.01 | 1.51 | 0.69 | 1.00 | 0.55 |
| MERRA-2 | 0.62 | 1.66 | 0.71 | 1.57 | 0.56 | |
| Wind Speed Max (m/s) | GEOS-IT | -1.11 | 2.74 | 0.53 | 1.68 | 0.41 |
| MERRA-2 | -0.18 | 2.57 | 0.55 | 2.49 | 0.41 |
IMERG
POWER also serves higher-resolution precipitation from NASA's GPM mission's IMERG product at 0.1° (~10 km). The 10 km resolution should allow for better representation of convective cells and other smaller scale precipitation events. Both Late and Final Runs include gauge adjustments, however it is possible that the Late Run is missing microwave satellite overpass data that is delivered after processing of the Late Run. These data are included in Final Runs. IMERG merges precipitation estimates from the GPM constellation passive-microwave and infrared sensors onto a 0.1° half-hourly grid, and the Final Run applies monthly gauge calibration from GPCC, whereas the Late Run uses climatological gauge adjustment (Huffman, 2020).
| Source | Temporal Start | Temporal End | Latency |
|---|---|---|---|
| IMERG Final Run | June 1, 1998 | 3.5 Months Behind Near Real Time | 3.5 Months |
| IMERG Late Run | End of IMERG Final Run | Near Real Time | 14 hours |
Warning
IMERG is available at the daily temporal level in UTC only. The time series will include both Late and Final Run data within a few months of NRT; end the analysis 3.5 months behind NRT when assessing trends.
Parameters
| Parameter | Long Name | Units | Notes |
|---|---|---|---|
| IMERG_PRECTOT | Total Precipitation | mm | Daily sum from half-hourly |
| IMERG_PRECLIQUID_PROB | Probability of Liquid Precipitation | — | Fraction (0–1) |
| IMERG_PRECRETRIEVALS | Precipitation Retrievals | count | Number of valid obs/day |
Validation IMERG vs. MERRA-2
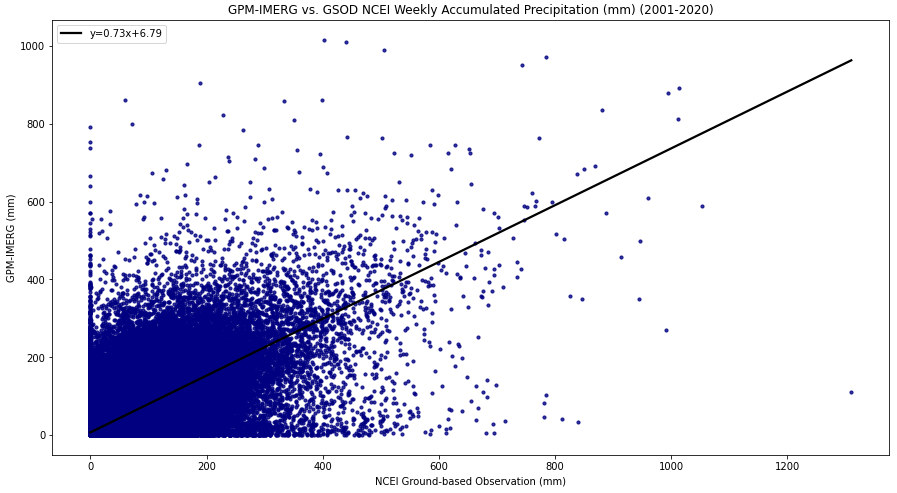
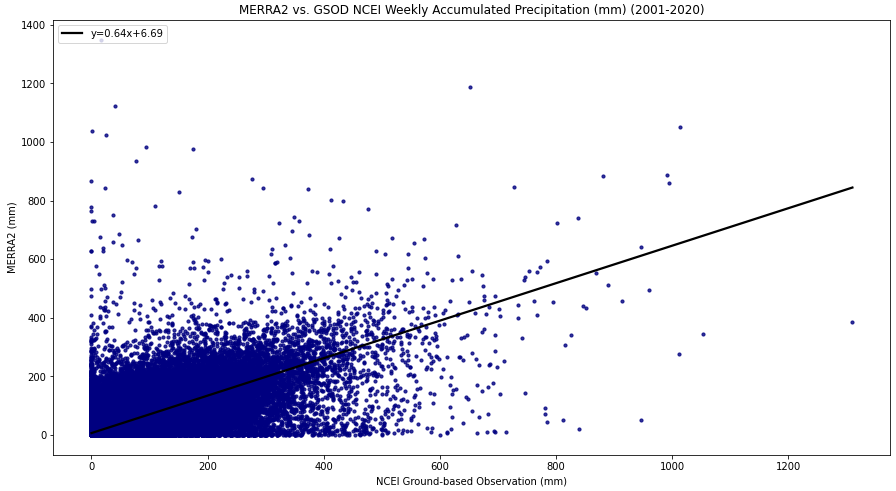
The POWER project compared accumulated precipitation from the NCEI GSOD observations to two precipitation sources: the Integrated Multi-satellitE Retrievals for GPM (IMERG) and MERRA-2. This comparison was done to evaluate the performance between the higher resolution IMERG against the MERRA-2 data product. Independent evaluations have found that satellite-gauge products such as IMERG can better capture spatial precipitation structure than coarser reanalyses, though relative skill varies by region, season, and accumulation period.
Two test cases were completed to conduct this comparison:
- All Events: pairs compared at the weekly and monthly level.
- Precipitation Only: pairs compared at the weekly and monthly level where precipitation was greater than zero.
The IMERG data is only available at the daily temporal in UTC time for POWER's services.
Data Integration
GSOD, IMERG, and MERRA-2 data were integrated into weekly and monthly accumulations based on the following steps and criteria:
- Cleaned the year-based GSOD site files by checking the quality codes, removing fill values, and aggregating the data into one site-based file.
- Joined the IMERG and MERRA-2 based data to each GSOD site-based file.
- Integrated site-based files by first requiring five days of data, across all three sources, before summing into a weekly accumulated value.
- From the weekly integrated site-based files by first requiring three weeks of data, across all three sources, before summing into a monthly accumulated value.
All Events
The Summary of Statistics below is associated with density scatter plots for all the data integration pairs.
| Accumulated | Bias | σ | RMSE | CC | Slope | Intercept | Rsqrd |
|---|---|---|---|---|---|---|---|
| IMERG Weekly | 2.79 | 24.10 | 24.26 | 0.72 | 0.73 | 6.79 | 0.51 |
| MERRA-2 Weekly | 1.35 | 20.64 | 20.69 | 0.76 | 0.64 | 6.69 | 0.58 |
IMERG - Weekly - All Events
MERRA-2 - Weekly - All Events
| Accumulated | Bias | σ | RMSE | CC | Slope | Intercept | Rsqrd |
|---|---|---|---|---|---|---|---|
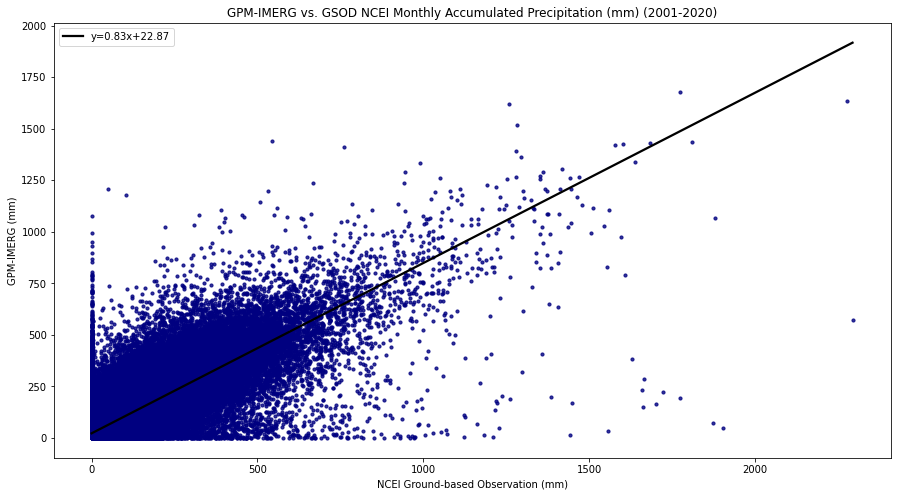
| IMERG Monthly | 11.63 | 58.36 | 59.51 | 0.83 | 0.83 | 22.87 | 0.68 |
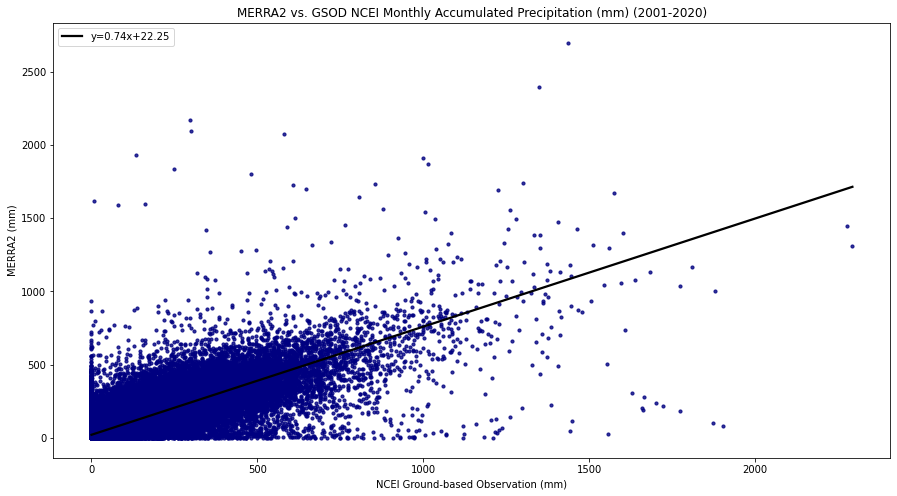
| MERRA-2 Monthly | 5.31 | 55.48 | 55.74 | 0.83 | 0.74 | 22.25 | 0.69 |
IMERG - Monthly - All Events
MERRA-2 - Monthly - All Events
Precipitation Only
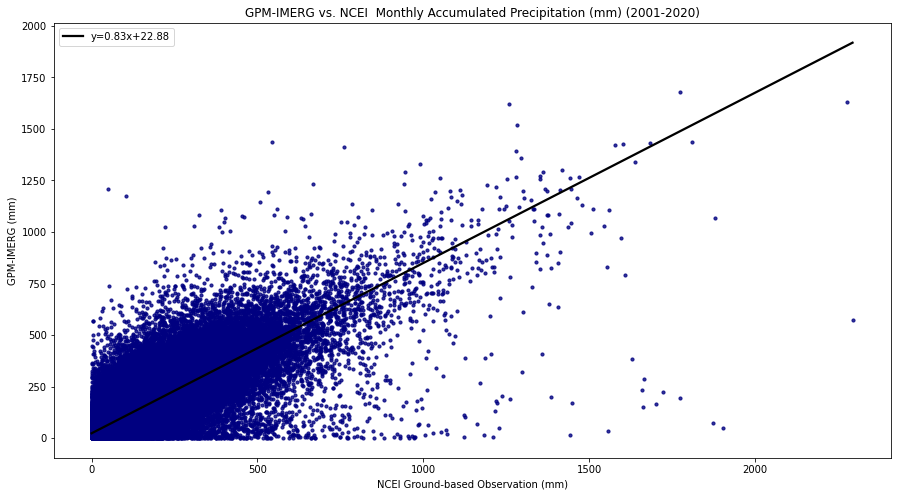
The Summary of Statistics below is associated with density scatter plots, where the data integration pairs for IMERG or MERRA-2 and the GSOD Ground Observation are both greater than zero.
| Accumulated | Bias | σ | RMSE | CC | Slope | Intercept | Rsqrd |
|---|---|---|---|---|---|---|---|
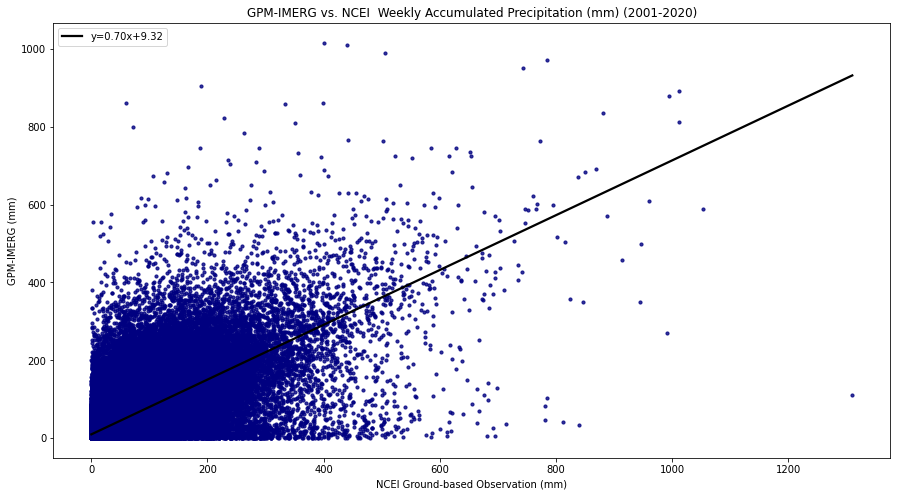
| IMERG Weekly | 2.09 | 28.92 | 29.00 | 0.71 | 0.70 | 9.32 | 0.50 |
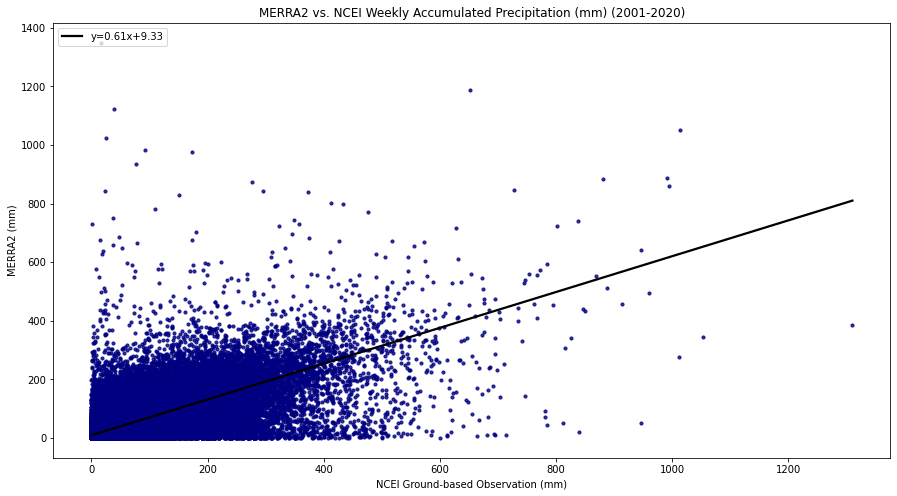
| MERRA-2 Weekly | -0.18 | 24.87 | 24.87 | 0.76 | 0.61 | 9.33 | 0.57 |
IMERG - Weekly - Precipitation Only
MERRA-2 - Weekly - Precipitation Only
| Accumulated | Bias | σ | RMSE | CC | Slope | Intercept | Rsqrd |
|---|---|---|---|---|---|---|---|
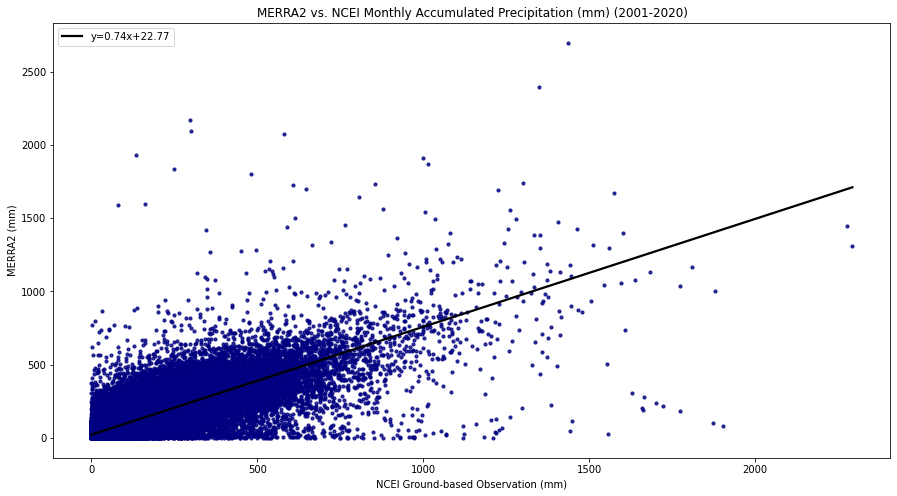
| IMERG Monthly | 8.79 | 59.25 | 59.90 | 0.84 | 0.83 | 22.88 | 0.70 |
| MERRA-2 Monthly | 1.31 | 57.31 | 57.32 | 0.84 | 0.74 | 22.77 | 0.70 |
IMERG - Monthly - Precipitation Only
MERRA-2 - Monthly - Precipitation Only