Energy Fluxes
The surface shortwave (SW) radiation (or solar insolation) and the longwave (LW) radiation (or thermal radiation) available from the POWER data archives are based upon observational data from satellites. The basic observational data is the amount of radiative energy emerging from the Earth’s atmosphere at certain ranges of wavelengths from the solar through the thermal infrared. The amount of radiation measured is affected by atmospheric absorption, emission, and scattering processes. Radiative transfer models and radiative transfer-based parameterizations using the observations and information about the atmospheric constituents, such as gaseous concentrations, aerosols, and clouds, are used for estimating the SW and LW radiative fluxes. This satellite-plus-radiative-transfer approach underpins both the GEWEX SRB and CERES surface flux products that supply POWER, which combine TOA radiance observations with assimilated atmospheric state to infer surface irradiance.
Energy flux parameters (e.g. Solar Irradiance, Thermal IR, and Cloud Properties) are derived from NASA Langley Research Center's SRB Release 4-Integrated Product (R4-IP) archive in association with the GEWEX program and NASA's CERES SYN1deg and FLASHFlux (Kratz et al., 2014) projects. FLASHFlux data is processed by the POWER team on a daily basis and appended to the daily time series to provide low latency products which are generally ready within about four days of near real time. FLASHFlux is the dedicated low-latency CERES stream, applying fast radiative algorithms to the earliest instrument data to deliver fluxes within roughly a week of observation. Daily mean solar radiation data for the time period from January 1, 2001 to within approximately 3–4 months of current time, or real time, are taken from NASA’s CERES SYN1deg Edition 4.2. Filling in from that point to near real time (about 1 week) is CERES FLASHFlux Version 4A. CERES SYN1deg Edition 4 delivers climate-quality, fully calibrated hourly-to-monthly surface fluxes, whereas FLASHFlux trades some calibration accuracy for latency of about one week to support near-real-time applications.
A summary of the time period and source of fluxes is presented in this table:
| Source | Temporal Start | Temporal End | Latency |
|---|---|---|---|
| SRB 4.0-IP | January 1, 1984 | December 31, 2000 | |
| CERES SYN1deg Edition 4.2 | January 1, 2001 | NRT minus ~3–4 months | |
| CERES FLASHFlux Version 4A | NRT ~3–4 months | Near Real Time | 5–7 Days |
The POWER project provides data at the native source resolutions from the data providers; primary solar resolution is a global 1° latitude by 1° longitude grid from both CERES SYN1deg and GEWEX SRB. CERES SYN1deg is the primary global product used for POWER solar fluxes whose sub-daily fluxes are constructed through geostationary-augmented temporal interpolation between CERES observations (Doelling et al., 2013).
Validation of the satellite-based values was conducted via comparisons to surface observations using the 1° gridded values. Surface reference networks such as Baseline Surface Radiation Network (BSRN) provide the high-accuracy ground truth used for these gridded comparisons See Rutan et al., 2015 for in-depth validation of CERES. Further validation results are presented below for each processing source. The quality of surface-based measurements are generally considered more accurate than satellite-derived values. However, measurement uncertainties from instrument calibration drift, operational uncertainties, instrumental changes, or data gaps are often unknown or unreported for many surface data sets. Estimated instantaneous uncertainties for solar radiation measurements are on the order of 3-5% (Michalsky et al., 1999 Wild et al., 2013, Wild et al 2017) while "end-to-end" uncertainties can be much higher (11-21%) (Franssen et al., 2010). Specialized high-quality research sites such as those in the BSRN are estimated to be more accurate by a factor of two. BSRN was established specifically to provide research-grade surface radiation measurements with well-characterized uncertainties for the validation of satellite-derived and modeled fluxes.
It is noted that both the NASA SRB project and CERES SYN1deg focus on providing high-quality estimates of the Earth's top-of-atmosphere (TOA) and surface solar insolation in support of NASA's effort to quantify components of the Earth's radiation budget, while the focus of the CERES FLASHFlux project is to provide solar data within one week of satellite observations with well validated estimates of its accuracy. The POWER data sets concurrently concatenate these data sets. However, it is not recommended to use these fluxes to assess climate trends that encompass changes in the source data without a careful assessment and analysis that accounts for discontinuities and uncertainties in the parameter values. Because GEWEX SRB R4-IP and CERES SYN1deg are produced with different instruments, input cloud retrievals, and radiative transfer implementations, their concatenation at the January 1, 2001 boundary can introduce a step discontinuity that is not a physical climate signal.
Warning
The time series of daily surface energy fluxes data may include multiple data sources; accordingly, it is not recommended for use in assessing climate trends that encompass a source data change.
While it is neither the intent nor purpose of this document to provide a detailed description of the methodology for inferring solar data from satellite observations, a brief synopsis for each is provided in the following sections.
SRB 4-IP
NASA Langley Research Center's Surface Radiation Budget (SRB) project in association with the World Climate Research (WCRP) GEWEX program endeavors to estimate the surface radiative components of the Earth's radiative energy budget. The latest version processes long-term estimates of global 3-hourly surface and cloud information and integrates this with ancillary information such as gaseous constituents of the atmosphere (water vapor, carbon dioxide and ozone) and aerosols to estimate the solar and thermal IR radiative fluxes at the surface and top-of-atmosphere (TOA). POWER data sets provide both the solar (shortwave) and thermal infrared (longwave) fluxes to users. The "IP" in Release 4-IP stands for Integrated Products of the GEWEX community. This section briefly describes the algorithms and provides an overview of the data quality of these surface estimates. SRB R4-IP integrates ISCCP-derived cloud properties with assimilated temperature, moisture, and ozone fields to drive its shortwave and longwave radiative transfer on a global 1° grid.
The shortwave (SW) algorithm uses a modified method of Pinker and Laszlo (1992) to solve the radiative transfer equation and provide the SRB Release 4-IP estimates of surface SW solar insolation. This method involves the use of a radiative transfer model, along with cloud parameters derived from the International Satellite Cloud Climatology Project (ISCCP) HX data (Young et al., 2018) and temperature and moisture profiles taken from ISCCP nnHIRS with supplements from 4-D data assimilation products provided by NASA Goddard Space Flight Center (GSFC) and produced with Modern Era Retrospective-Analysis for Research and Applications (MERRA-2) and ozone column amounts from satellite measurements. Three satellite visible radiances are used: the instantaneous clear-sky radiance, the instantaneous cloudy-sky radiance, and the clear-sky composite radiance, which is a representation of a recent dark background value. The observed satellite radiances are converted into broadband shortwave TOA albedos, using Angular Distribution Models (ADM) from the Earth Radiation Budget Experiment (ERBE; Smith et al., 1986). The spectral shape of the surface albedo is fixed by surface type. The radiative transfer model (through the use of lookup tables) is then used to find the absolute value of the surface albedo which produces a TOA upward flux which matches the TOA flux from the conversion of the clear-sky composite radiance. For this step, a first guess of the aerosol amount is used. The aerosol used for this purpose is a fully variable composition aerosol, using the Max-Planck Aerosol Climatology (MACv1) (Kinne et al.,2013). The surface albedo now being fixed, the aerosol optical depth is chosen within the radiative transfer model to produce a TOA flux which matches the TOA Flux from the conversion of the instantaneous clear-sky radiance. Similarly, the cloud optical depth is chosen to match the TOA flux implied from the instantaneous cloudy-sky radiance. With all parameters now fixed, the model outputs a range of parameters including surface and TOA fluxes. NASA’s SRB Release 4-IP parameters are output on a global 1° latitude by 1° longitude grid at 3-hourly temporal resolution for each day of the month. This Pinker–Laszlo shortwave retrieval is the heritage physical basis for the GEWEX SRB surface insolation products and is documented in the SRB R4-IP overview Stackhouse et al., 2021.
The longwave (LW) algorithm uses LaRC Fu-Liou (Rose et al., 2013) thermal infrared radiative transfer code with cloud and surface parameters requiring cloud, atmospheric profile information, and surface properties. Inputs to the algorithm were obtained from the following sources: The ISCCP HX cloud properties were separated into categories of high, middle, and low where each layer could be composed of ice or water. Cloud fractions and cloud optical depths were determined within these categories. Cloud particle sizes were assumed, and cloud physical thicknesses were also designed based upon information from literature. Random overlap is used between the high, middle, and low layers to better approximate under cast conditions. Like the shortwave, MACv1 aerosol climatologies are also used in the computations of the fluxes. The LaRC Fu-Liou radiative transfer code is the same lineage used in CERES surface longwave processing, providing consistency between the SRB and CERES flux estimates that POWER concatenates.
The Direct and Diffuse Irradiances, consistent of all-sky (i.e. including the effect of clouds if present) total global solar radiation from the SRB archive, is the sum of diffuse and direct radiation on the horizontal surface. Estimates of all-sky diffuse, or diffuse horizontal irradiance (DHI), and direct normal radiation (DNI) are often necessary for the design of hardware such as solar panels, solar concentrators, day lighting, as well as agricultural and hydrology applications. From an observational perspective, DHI on a horizontal surface is that radiation remaining with DNI from the Sun's beam blocked by a shadow band or tracking disk. DHI is typically measured using a Sun tracking pyrheliometer with a shadow band or disk to block the direct radiation from the Sun. Similarly, from an observational perspective, DNI is the amount of the beam radiation impinging on a surface perpendicular to the beam and is typically measured using a pyrheliometer tracking the sun throughout the day. Reference DHI and DNI used to validate these partitioned components are drawn from BSRN stations, which measure global, diffuse, and direct beam irradiance with research-grade instrumentation.
Validation of GEWEX SRB 4-IP SW surface downward parameters has been performed by the GEWEX SRB team using land- and ocean-based observations. A summary of this validation at different time scales is presented at GEWEX SRB Validation. While the validation period is longer than the data available through POWER, the statistics obtained are applicable here. These comparisons use BSRN and other land/ocean reference sites as the observational baseline for the gridded SRB fluxes.
A summary of the daily mean all-sky shortwave (SW) radiative fluxes on a horizontal surface from NASA’s GEWEX SRB Release 4-IP validated against values from BSRN sites is presented below.
| Parameter | Region | Bias (%) | RMSE (%) |
|---|---|---|---|
| Daily Mean SW All-Sky Insolation Jan. 1, 1992–Jun. 30, 2017 | All Sites 60° Poleward 60° Equatorward | 0.7 -3.5 1.0 | 16.6 50.9 14.4 |
| Monthly SW All-Sky Insolation Jan. 1992–Jun. 2017 | All Sites 60° Poleward 60° Equatorward | -5.8 -6.6 -0.2 | 8.6 34.5 6.7 |
Comparison Plots: NASA’s GEWEX SRB Release 4.0 Shortwave Fluxes to BSRN Data
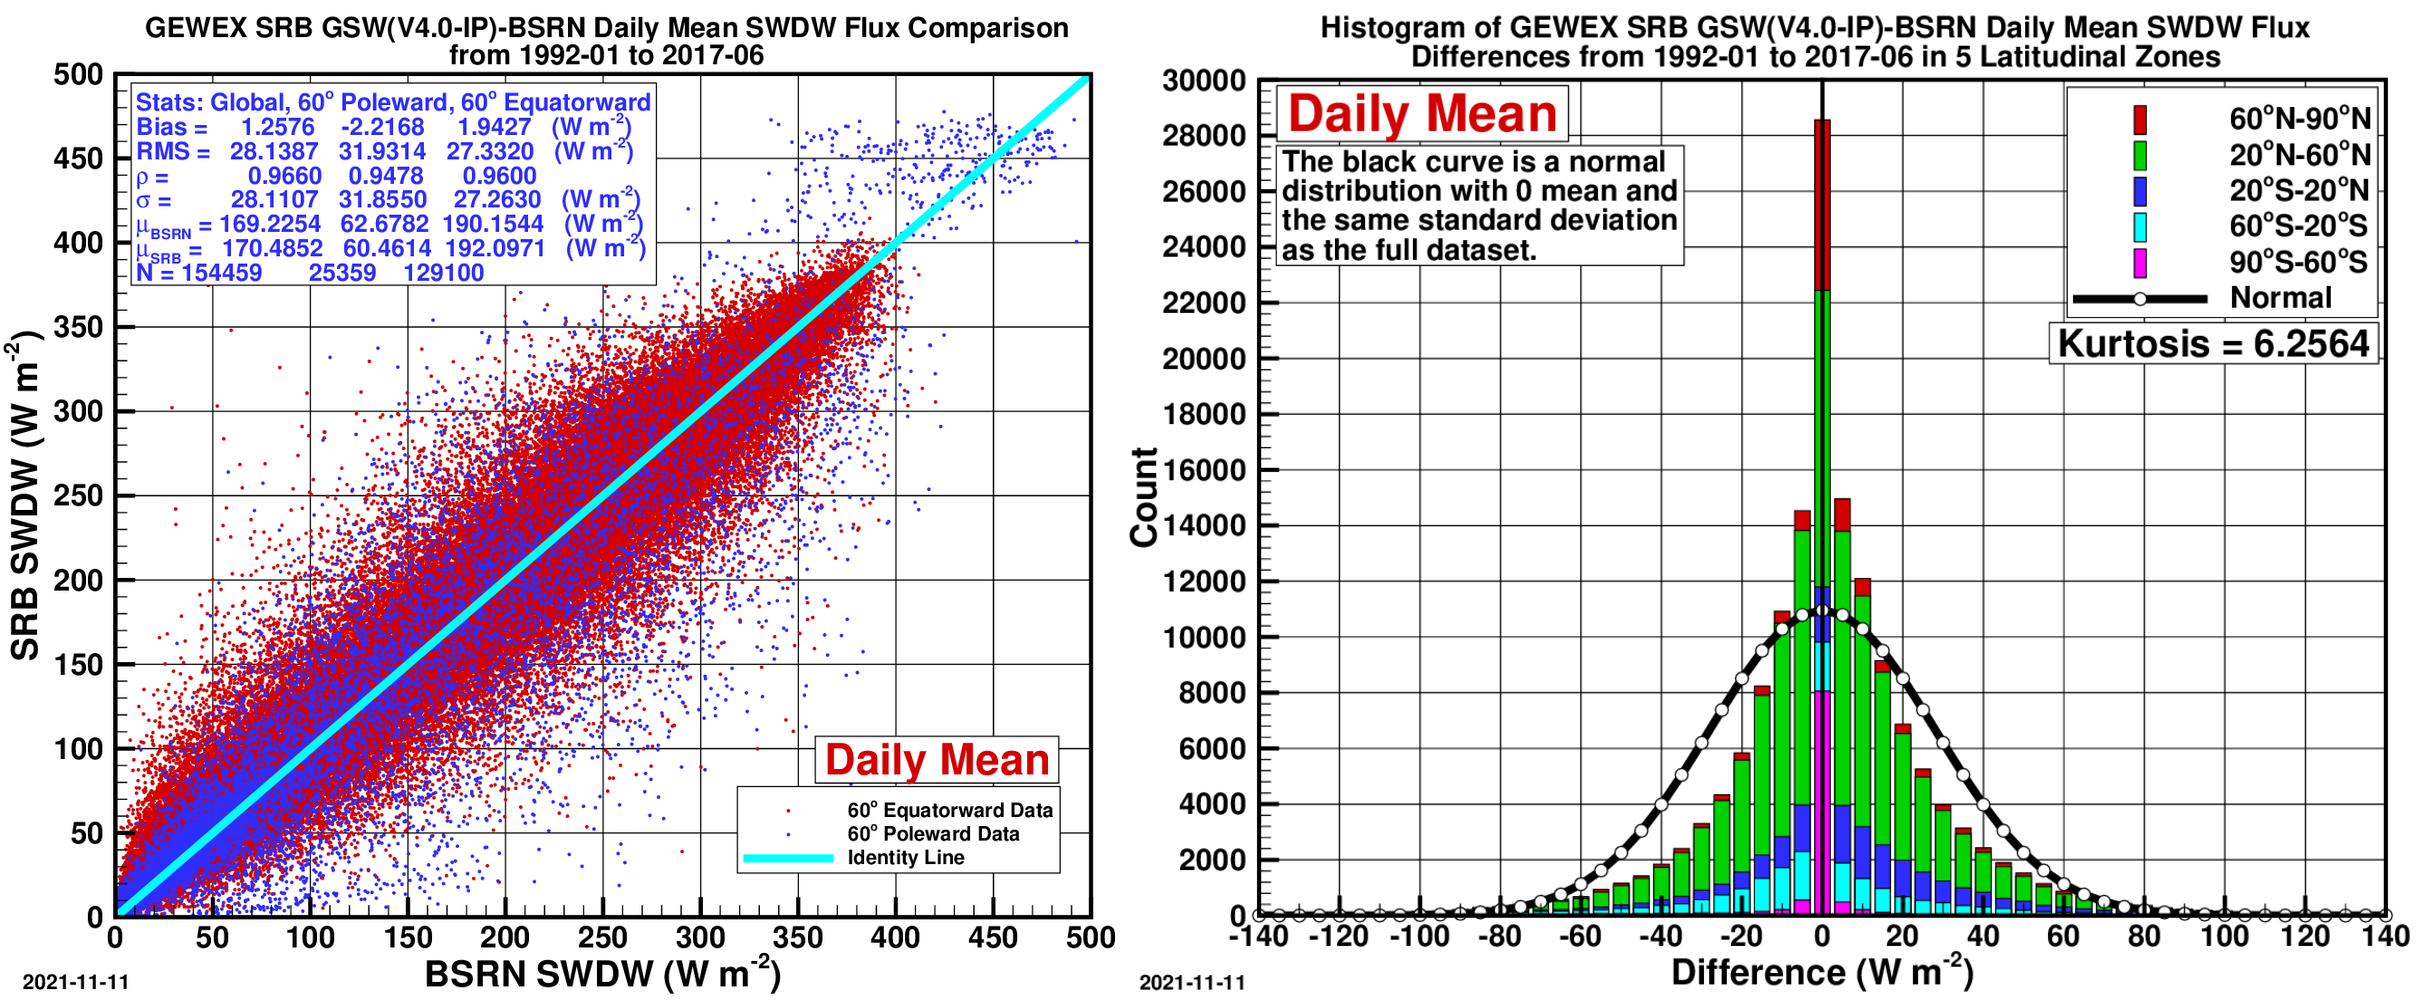
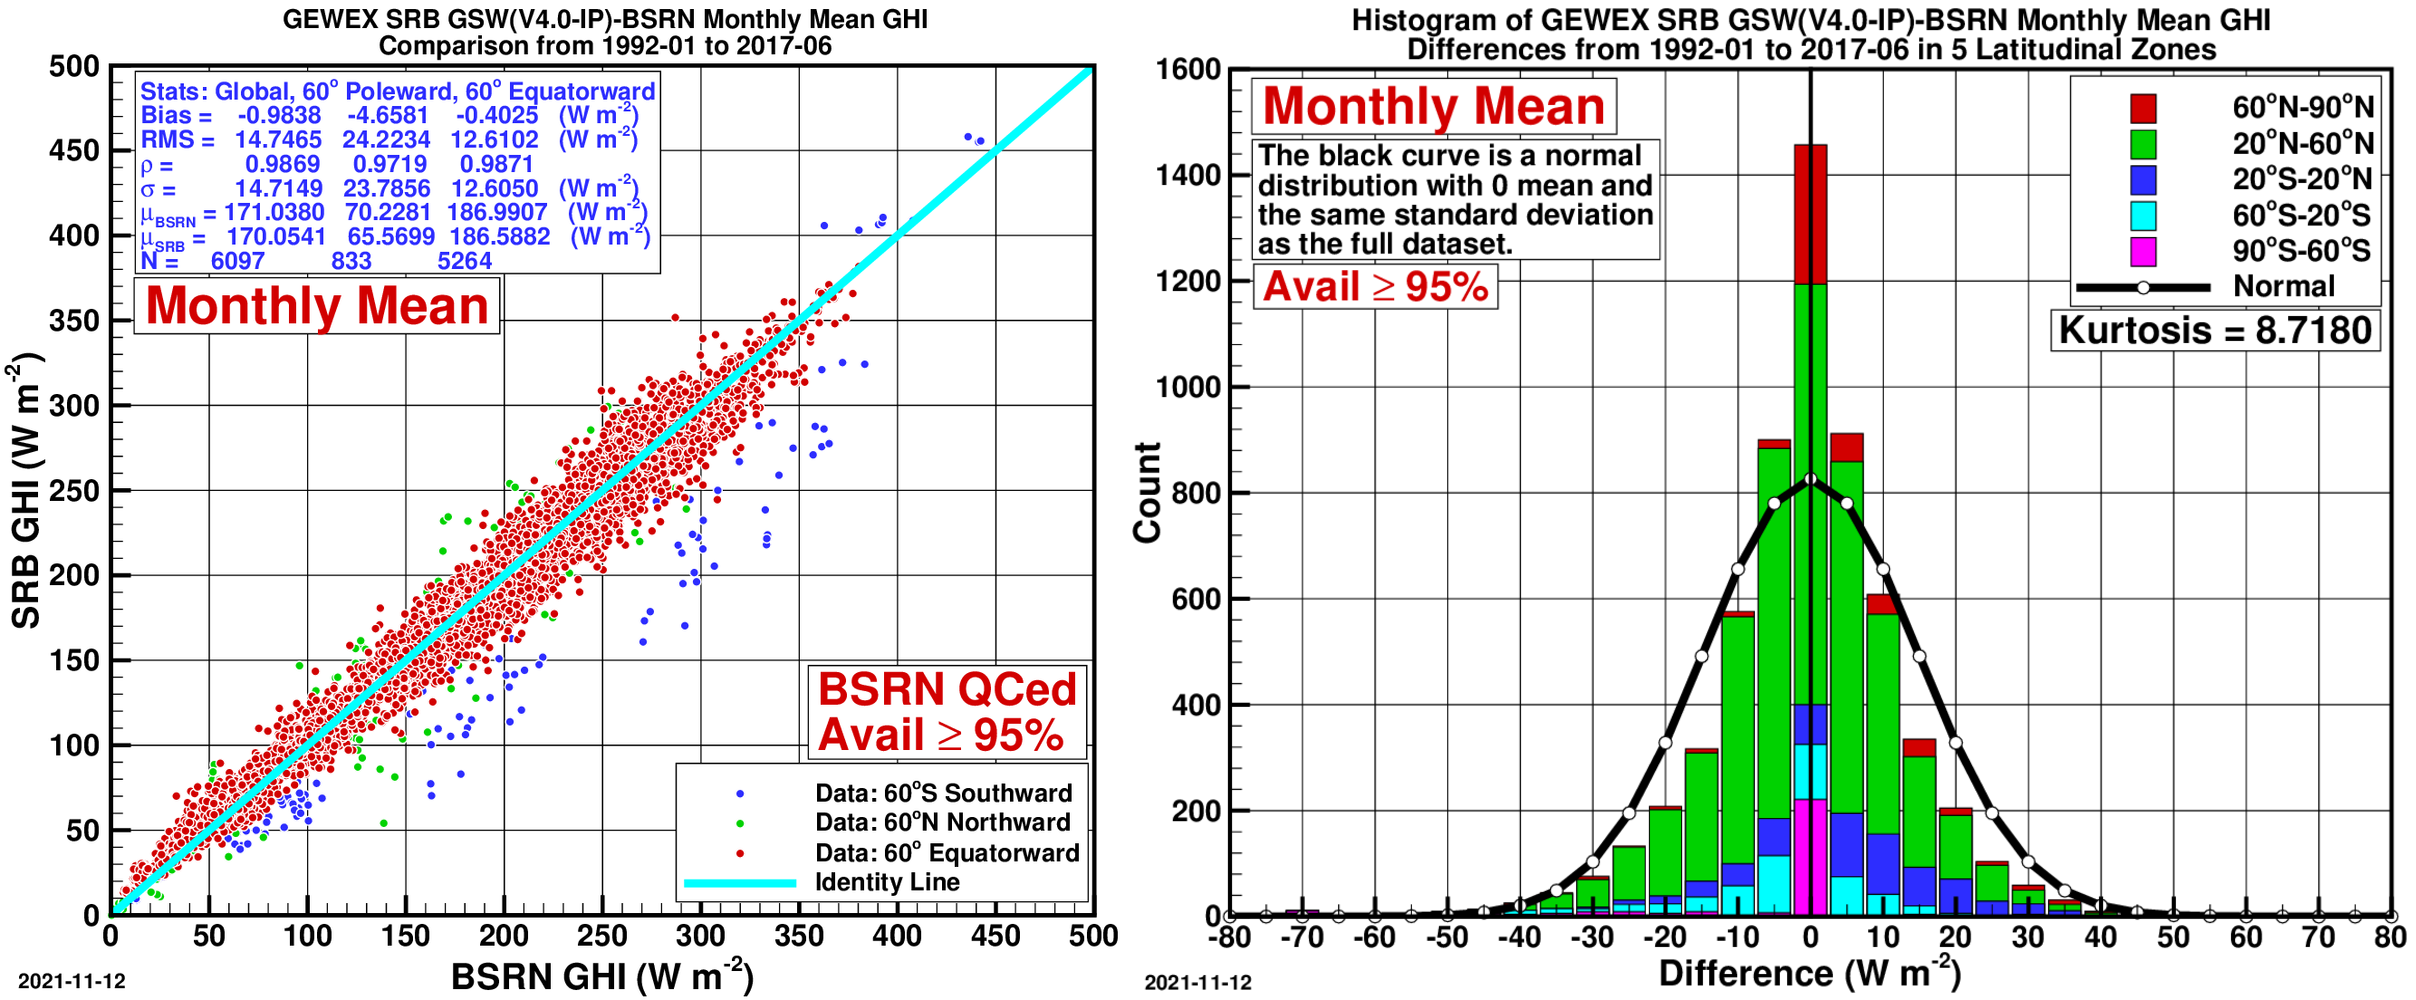
- Left — Scatter Plot of BSRN daily SW insolation vs. GEWEX SRB
- Right — Histogram of Differences:
Validation of GEWEX SRB 4-IP LW surface downward parameters has been done by the GEWEX SRB team using land- and ocean-based observations. A summary of this validation at different time scales is presented at GEWEX SRB Validation. While the validation period is longer than the data available through POWER, the statistics obtained are applicable here.
A summary of the daily mean all-sky longwave (LW) radiative fluxes on a horizontal surface from NASA’s GEWEX SRB Release 4-IP validated against values from BSRN sites is presented below.
| Parameter | Region | Bias (%) | RMSE (%) |
|---|---|---|---|
| Daily Mean LW All-Sky Radiative Flux Jan. 1, 1992–Dec. 31, 2009 NASA’s GEWEX SRB Release 4.0 | All Sites 60° Poleward 60° Equatorward | 0.46 -3.2 1.0 | 8.0 13.0 7.2 |
Comparison Plots: NASA’s GEWEX SRB Release 4.0 Longwave Fluxes to BSRN Data
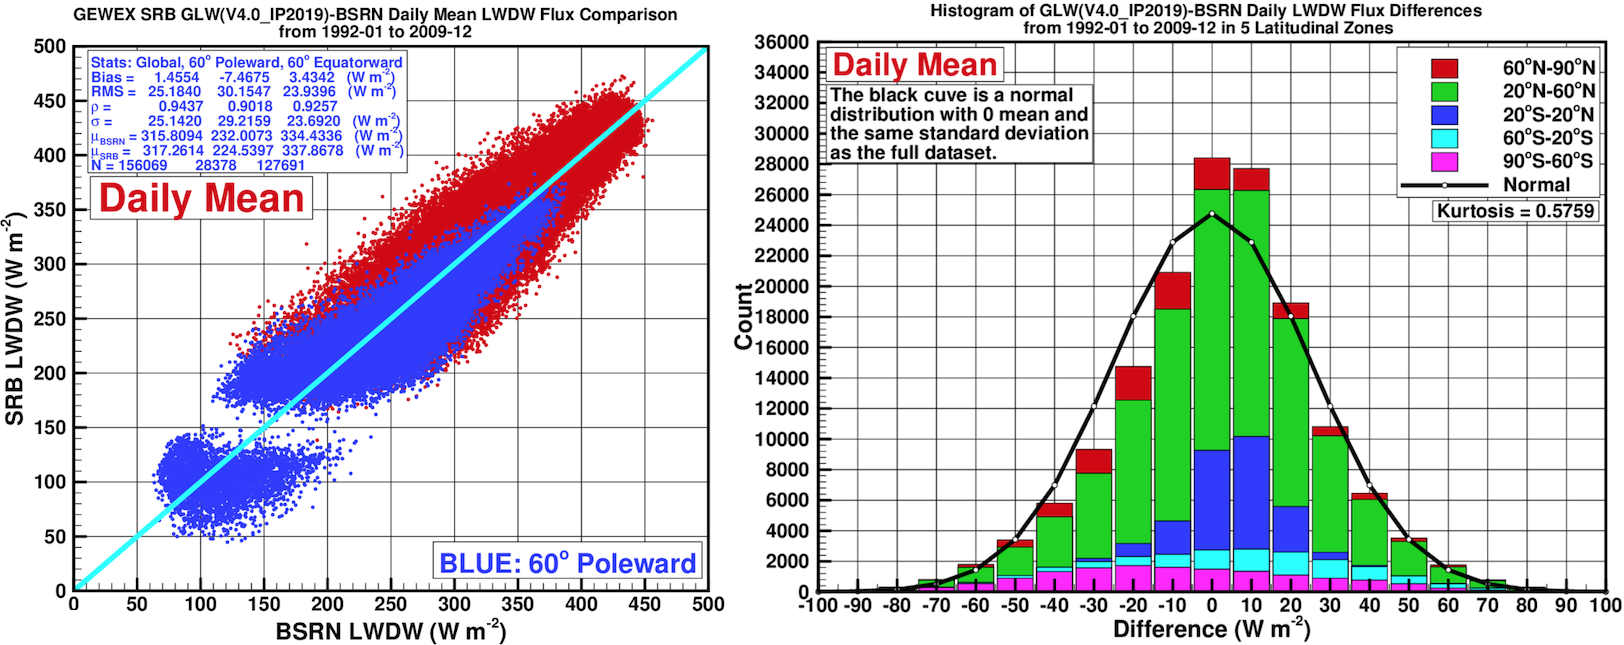
- Left — Scatter Plot:
- Right — Histogram of Differences:
SYN1deg
The CERES projects are based upon the algorithms developed for analysis and data collected by the Clouds and the Earth's Radiant Energy System (CERES) project. CERES is currently producing world-class climate data products derived from measurements taken aboard NASA's Terra and Aqua satellites. SYN1deg also incorporates geostationary cloud properties into the model calculations to produce global hourly fluxes. Details of SYN1deg inputs and algorithm can be found in Rutan et al., (2015). While of exceptional fidelity, CERES data products require extensive calibration checks and validation to assure quality and verify accuracy and precision. The result is that CERES data are typically released more than six months after acquisition of the initial measurements. For climate studies, such delays are of little consequence especially considering the improved quality of the released data products. The geostationary inputs are normalized to CERES and temporally interpolated to fill the gaps between Terra/Aqua overpasses, yielding continuous hourly surface fluxes (Doelling et al., 2013).
POWER provides the ultraviolet (UV) irradiance directly from CERES SYN1deg in all temporal levels from 2001 to months of Near Real Time (NRT). The UV Irradiance is available in all-sky conditions only. POWER provides ultraviolet A (UVA 315–400 nm), ultraviolet B (UVB 280–315 nm), and the ultraviolet radiation exposure index. These UV products are computed using the methodology of Su et al., (2005). The CERES SYN1deg shortwave fluxes that underpin these spectral UV partitions are documented in the SYN1deg surface flux references (e.g. Rutan et al., 2015).
A summary of all-sky shortwave (SW) radiative fluxes on a horizontal surface from NASA’s CERES SYN1deg (Ed4.1) validated against BSRN site observations is presented below. The monthly and daily validations are computed for April 2000 through December 2020, while hourly validation covers Jan., Apr., Jul., and Oct. 2019. These statistics use BSRN as the surface reference for the gridded CERES SYN1deg fluxes.
TODO[SCIENCE|Medium]: the validation tables cite SYN1deg Ed4.1 while the source description and tables elsewhere cite Ed4.2; reconcile the edition used and update consistently.
| Parameter | Region | Bias (%) | RMSE (%) |
|---|---|---|---|
| Hourly SW All-Sky Insolation Mid-seasonal months 2019 | All Sites 60° Poleward 60° Equatorward | -0.1 -1.9 0.9 | 12.6 19.4 13.1 |
| Daily SW All-Sky Insolation 2000–2020 | All Sites 60° Poleward 60° Equatorward | 0.3 2.1 0.2 | 13.5 36.5 12.1 |
| Monthly SW All-Sky Insolation 2000–2020 | All Sites 60° Poleward 60° Equatorward | 0.03 1.2 -0.03 | 5.7 20.2 4.7 |
| Daily SW DHI 2000–2020 | All Sites 60° Poleward 60° Equatorward | -0.6 -7.1 0.5 | 28.8 46.0 25.3 |
| Monthly SW DHI 2000–2020 | All Sites 60° Poleward 60° Equatorward | -0.1 -5.4 -0.03 | 15.0 30.5 12.0 |
| Daily SW DNI 2000–2020 | All Sites 60° Poleward 60° Equatorward | 3.5 16.6 2.4 | 36.3 99.4 30.1 |
| Monthly SW DNI 2000–2020 | All Sites 60° Poleward 60° Equatorward | 2.0 13.0 1.3 | 13.7 38.3 12.1 |
Comparison Plots: NASA’s CERES SYN1deg (Ed4.1) to BSRN Data: Global Horizontal Irradiance (GHI)
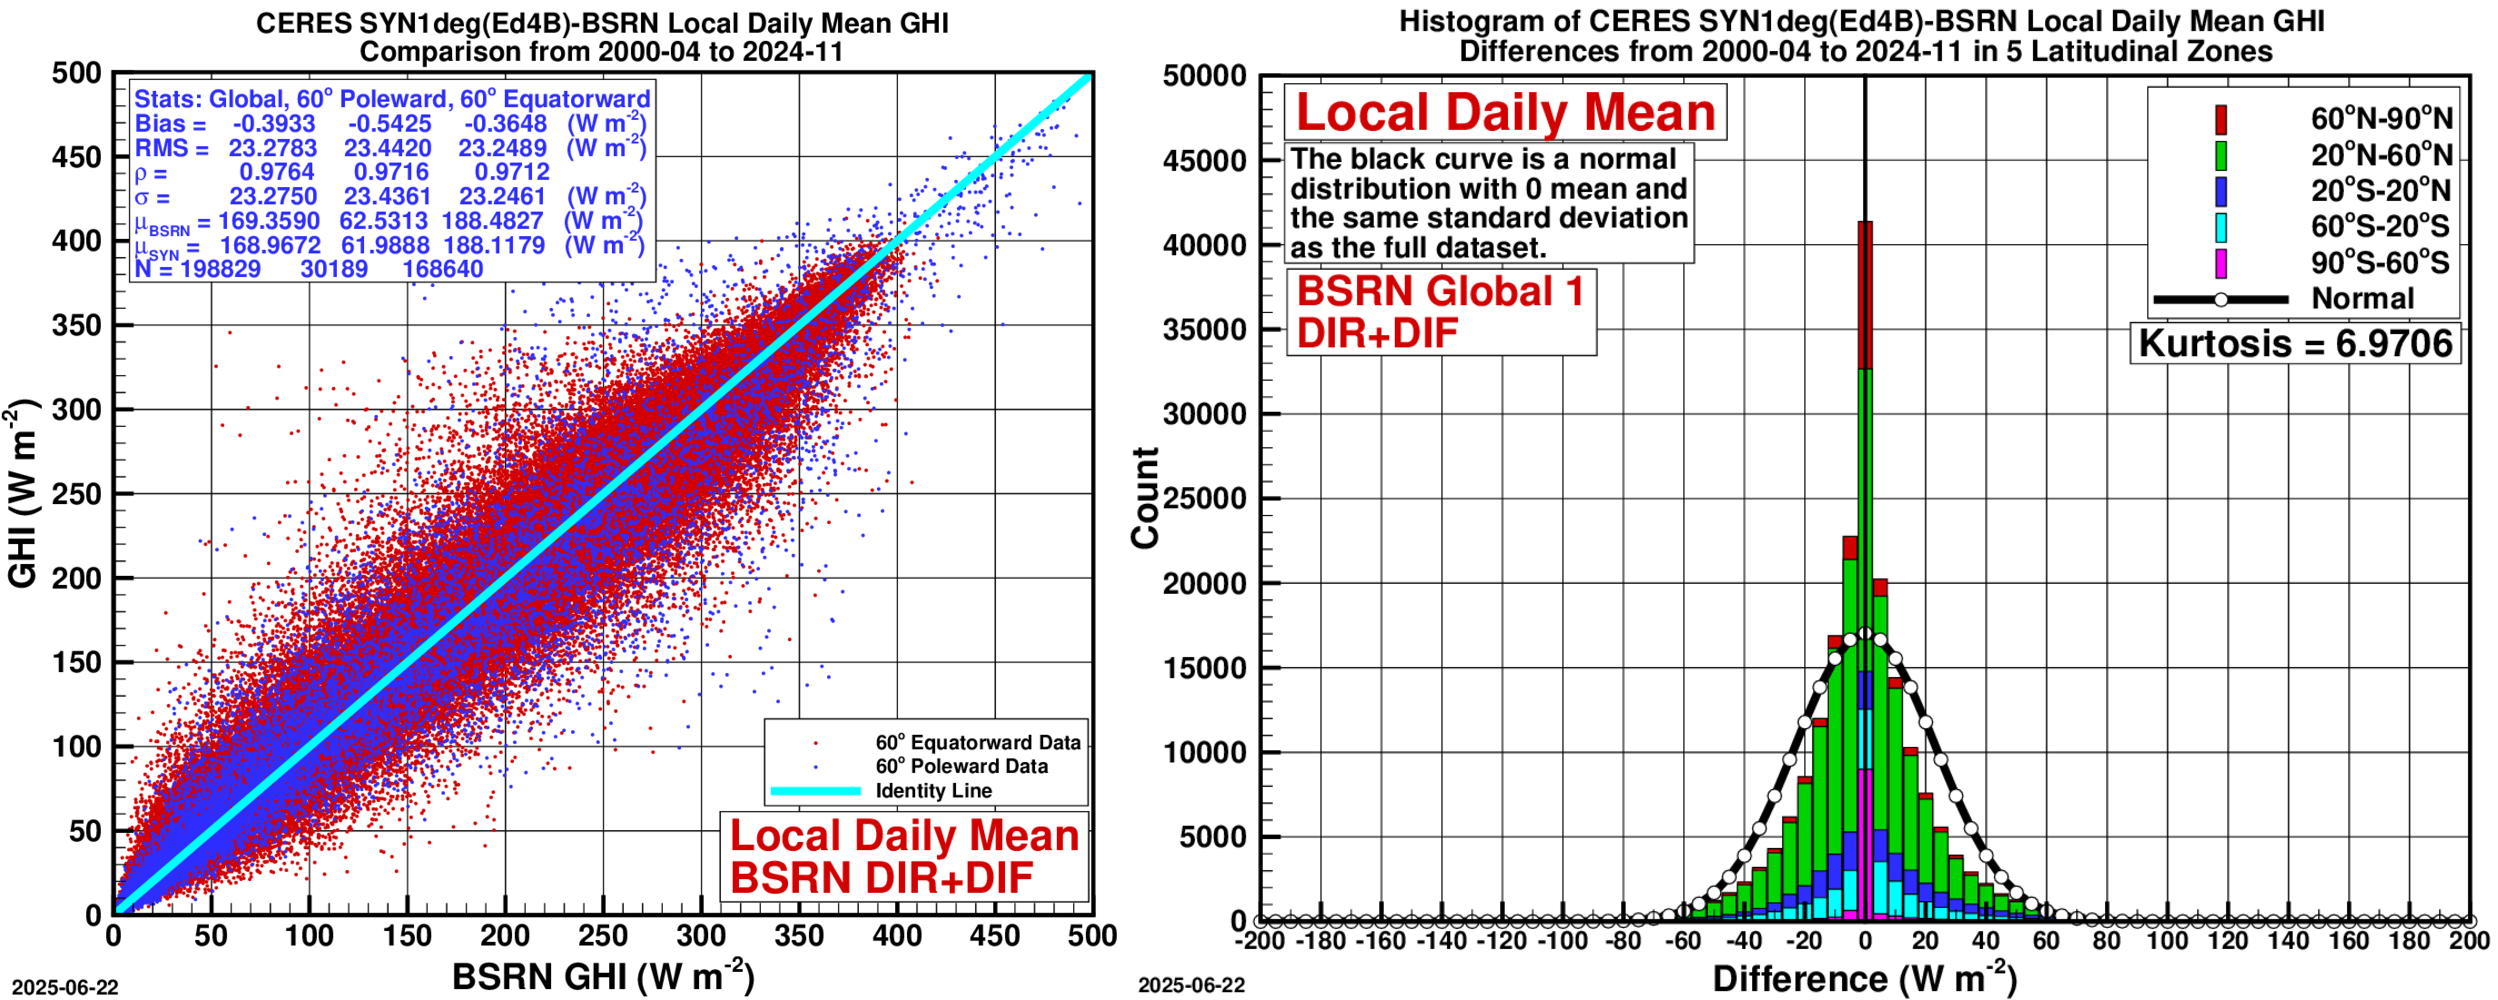
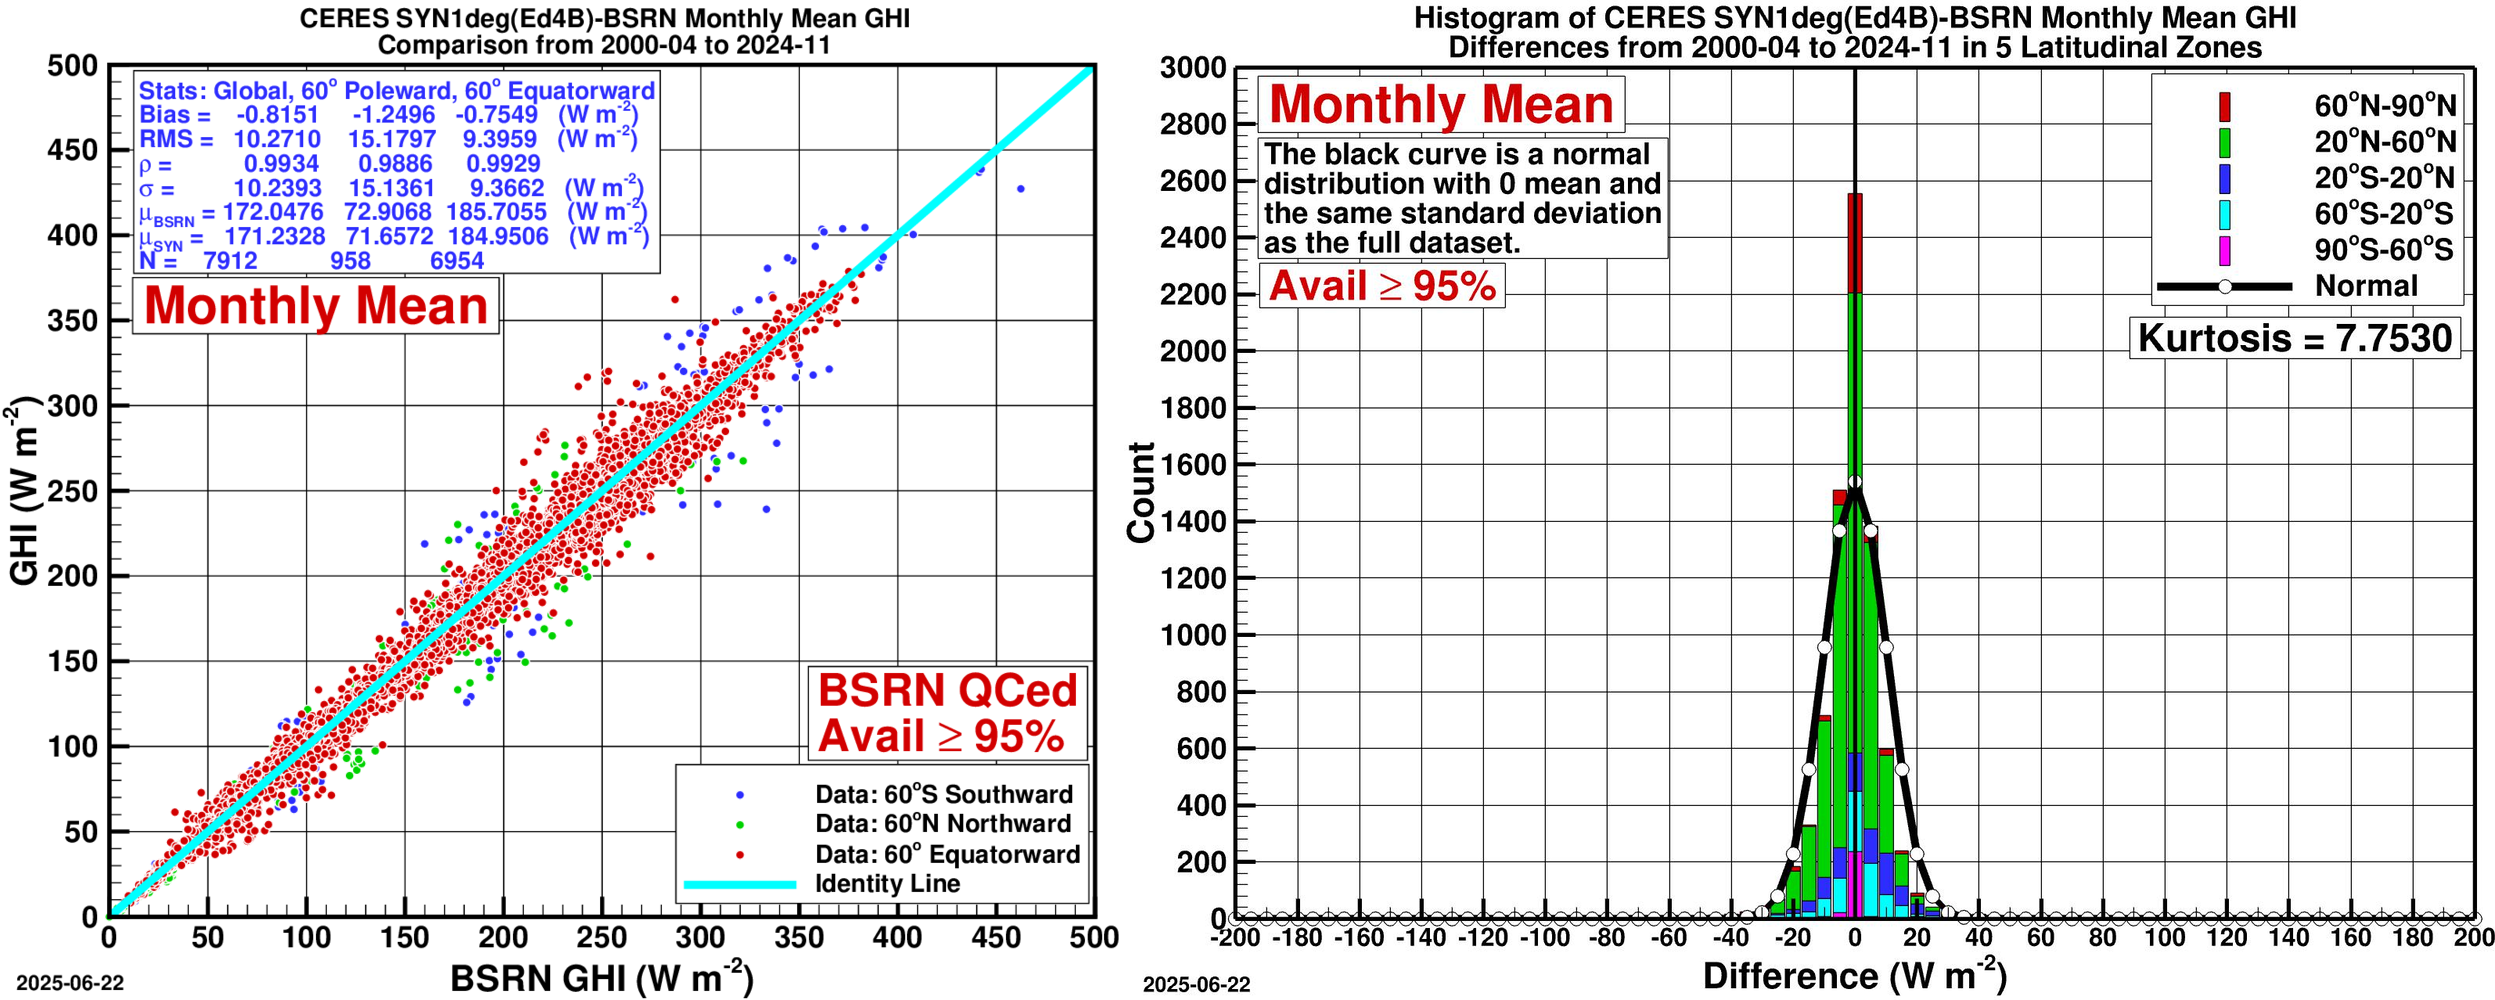
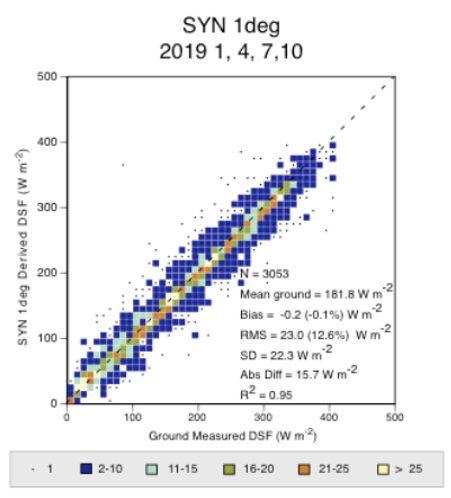
- Left — Scatter Plot:
- Right — Histogram of Differences:
Comparison Plots: NASA’s CERES SYN1deg (Ed4.1) to BSRN Data: Direct Horizontal Irradiance (DHI)
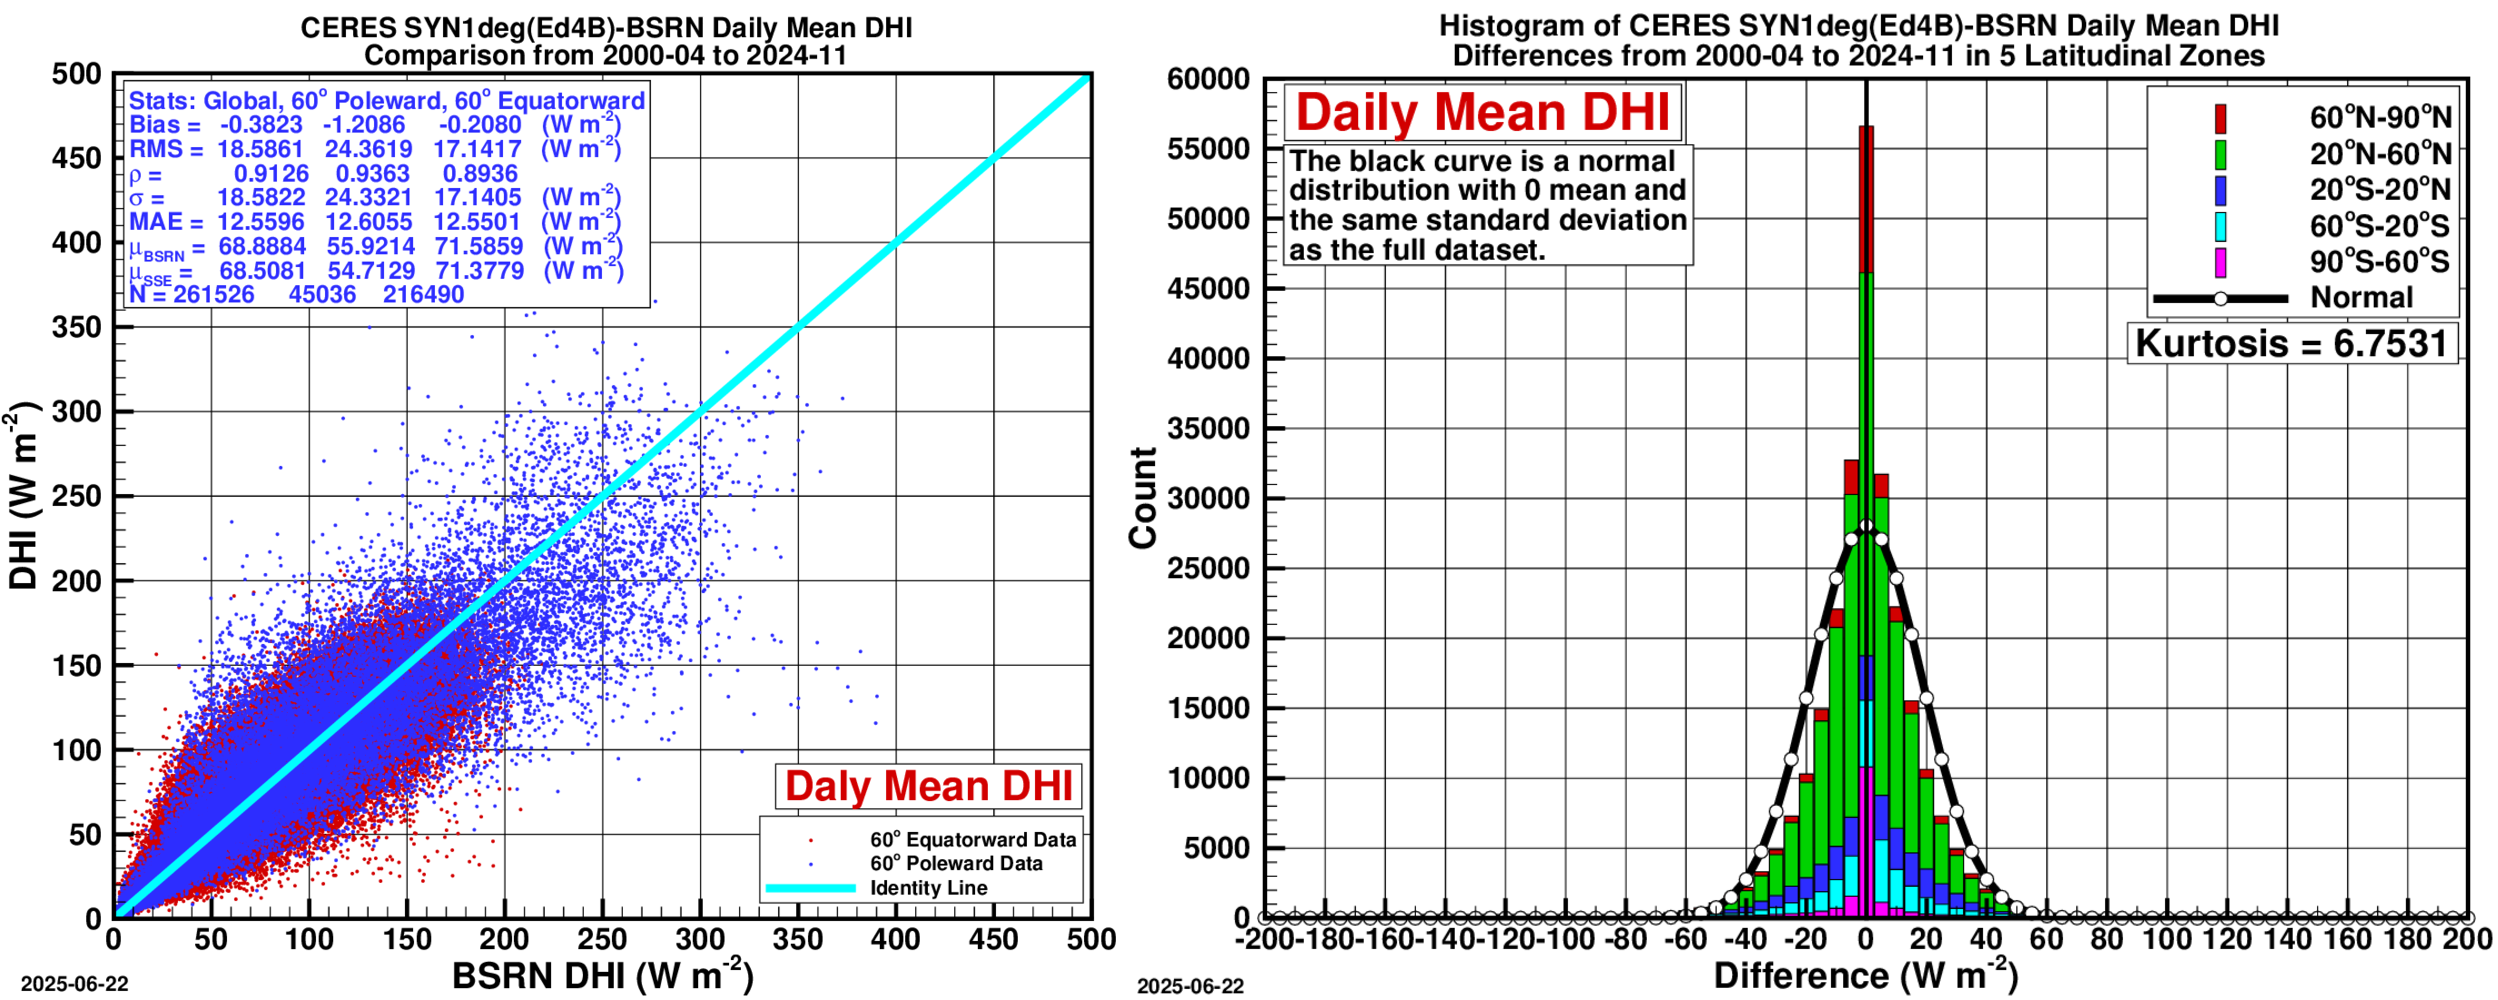
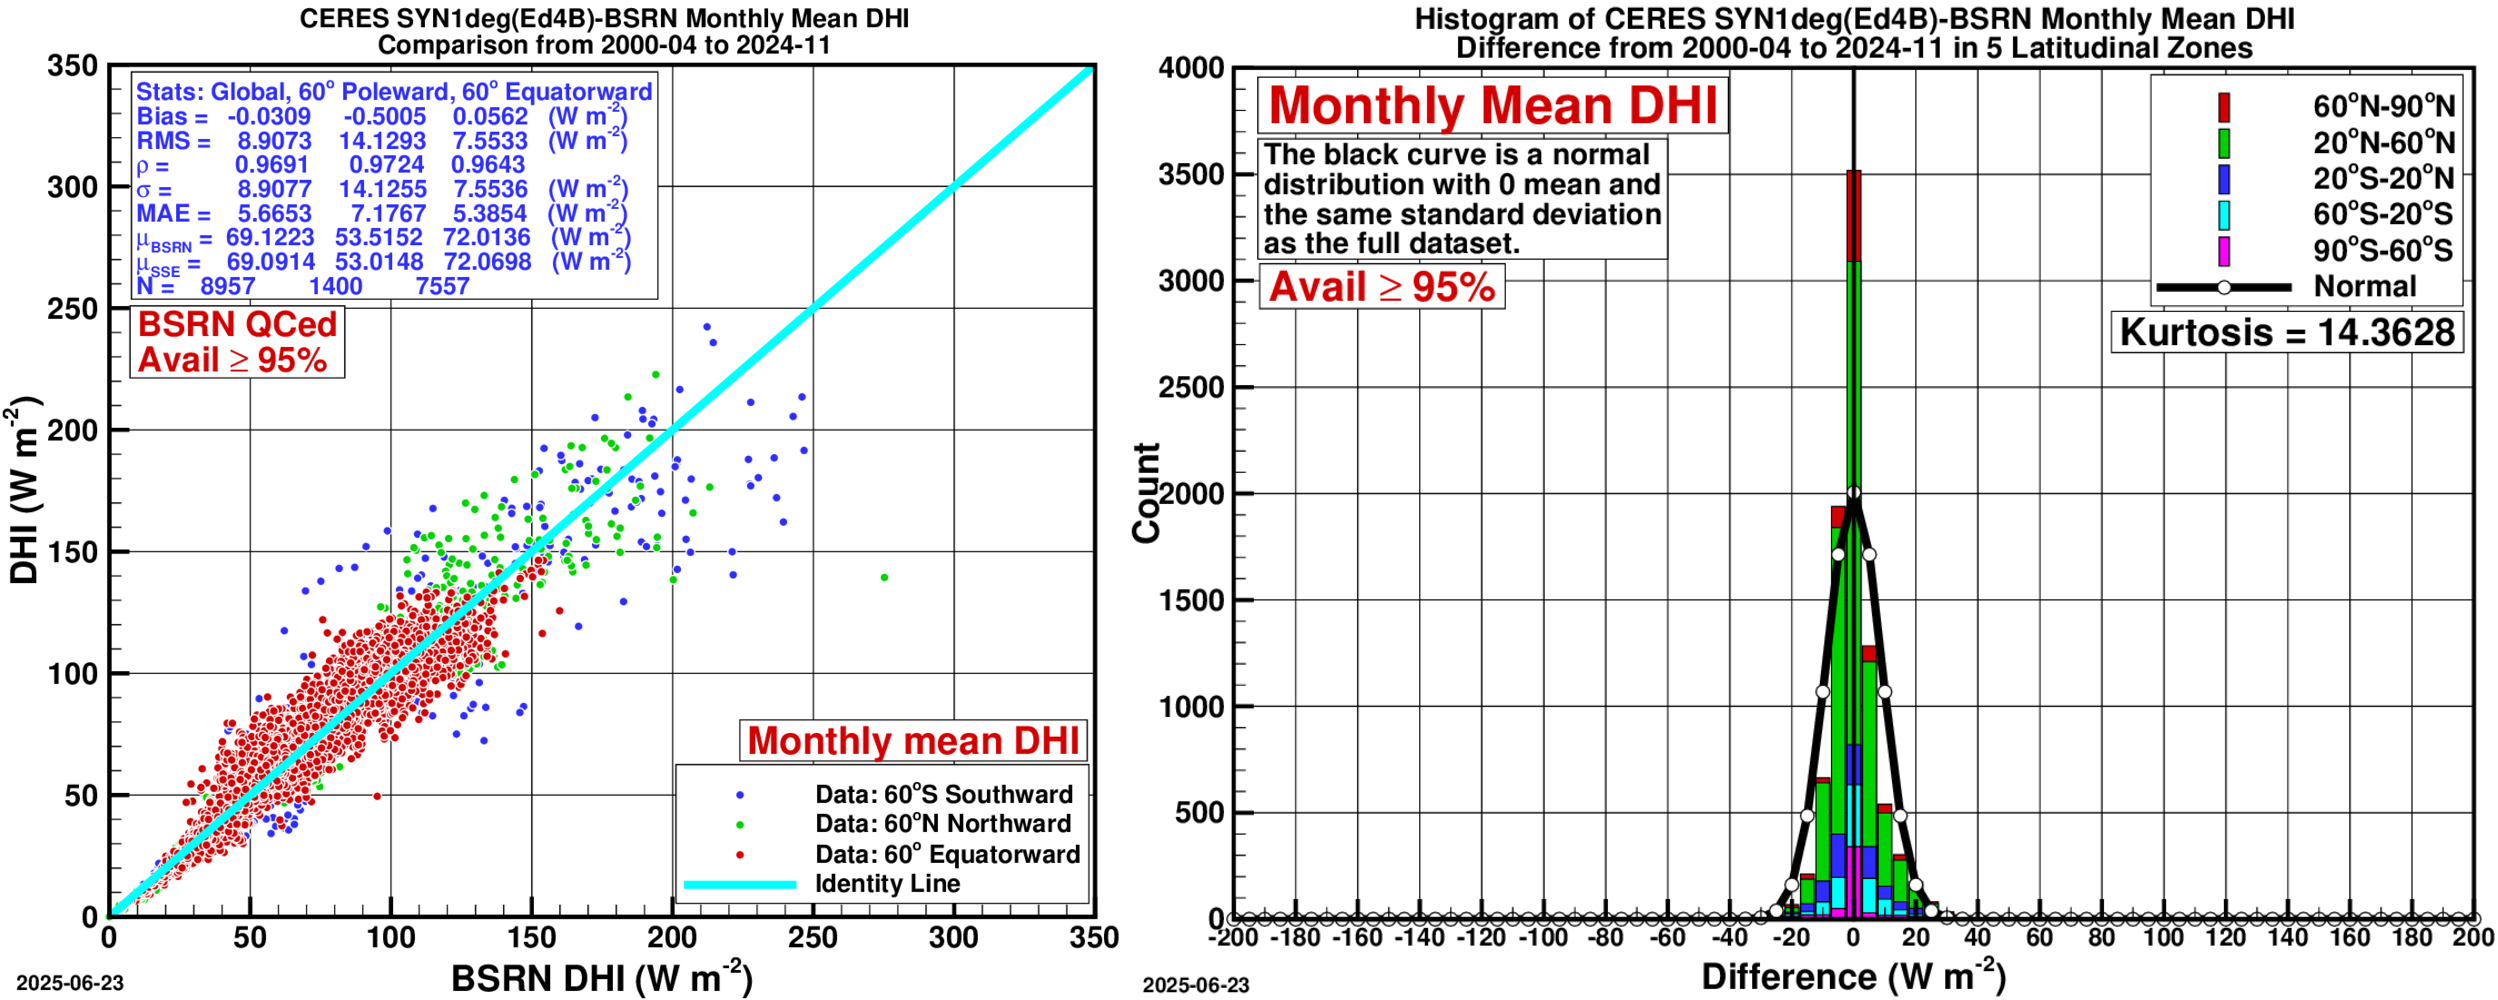
- Left — Scatter Plot:
- Right — Histogram of Differences:
Comparison Plots: NASA’s CERES SYN1deg (Ed4.1) to BSRN Data: Direct Normal Irradiance (DNI)
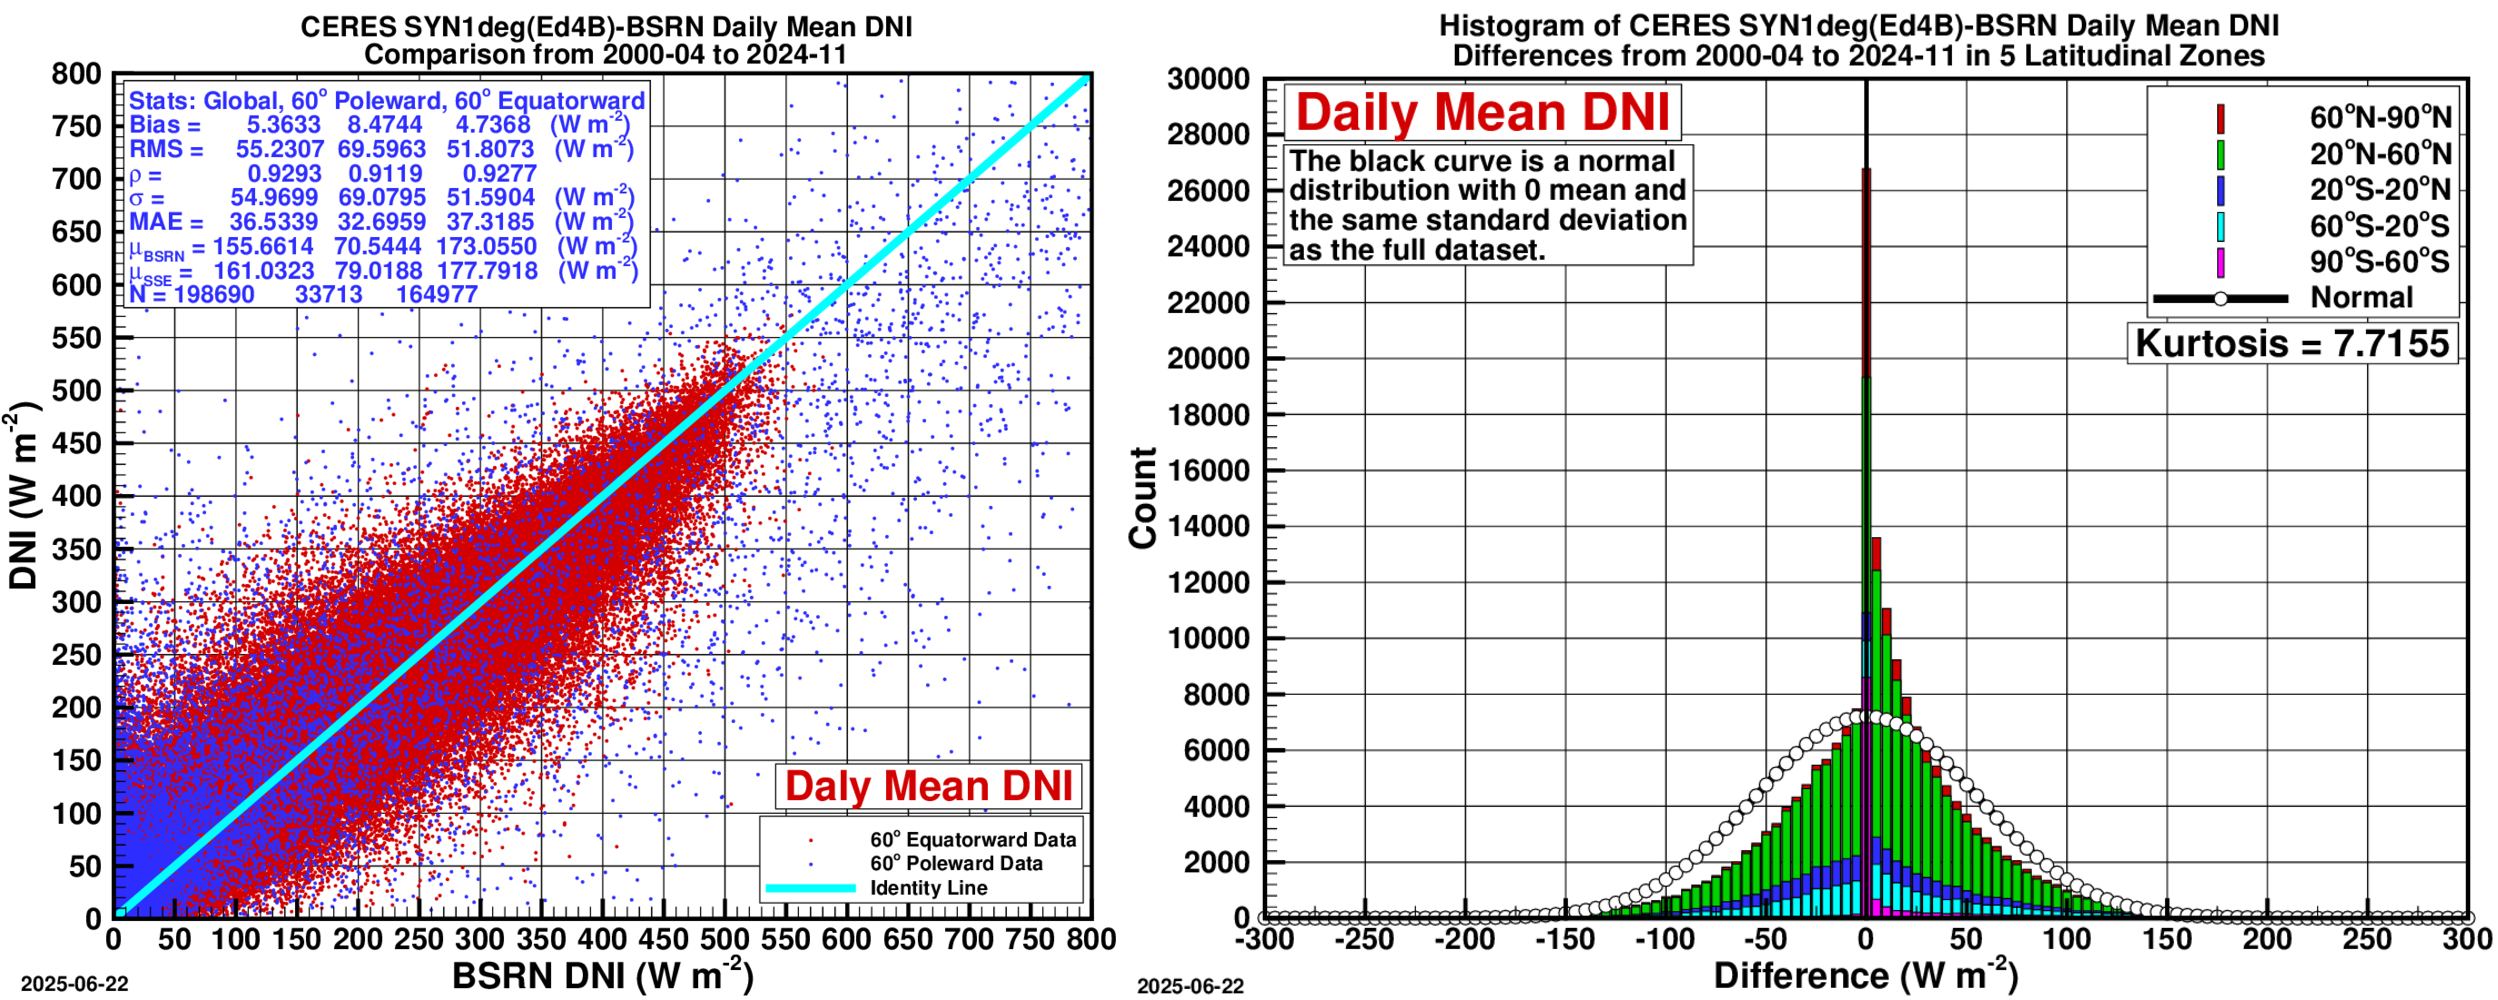
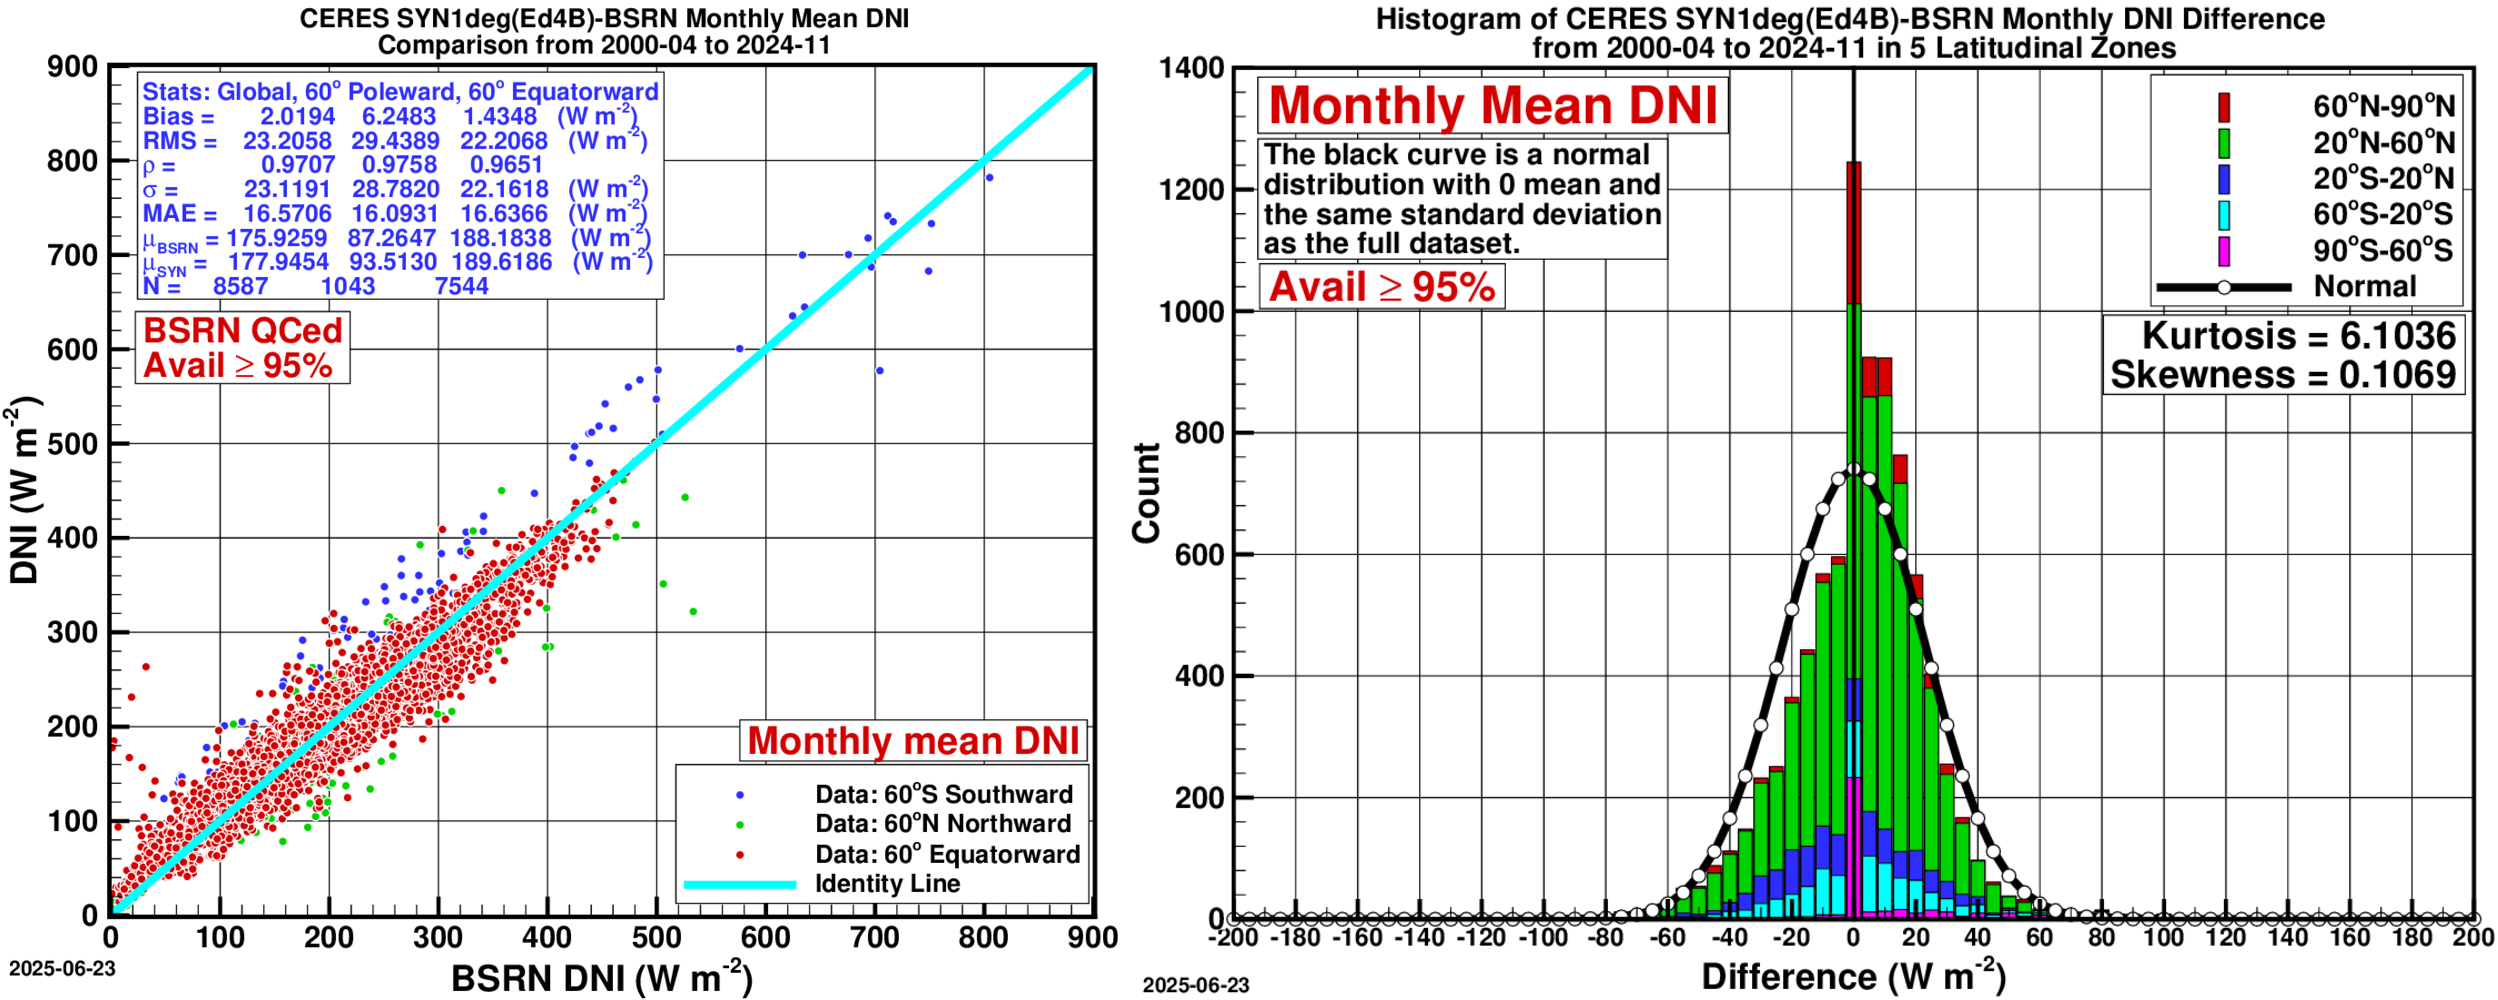
- Left — Scatter Plot:
- Right — Histogram of Differences:
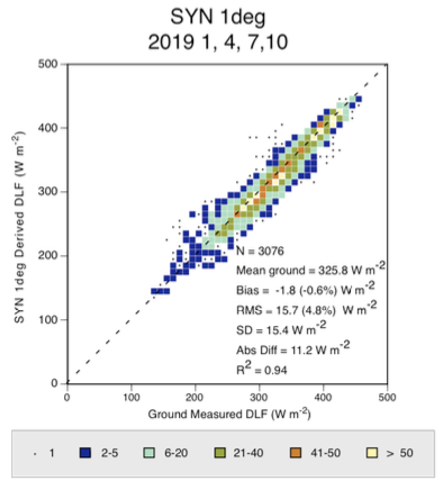
A summary of hourly all-sky longwave (LW) radiative fluxes on a horizontal surface from NASA’s CERES SYN1deg (Ed4.1) validated against values from BSRN sites for Jan., Apr., Jul., and Oct. 2019.
| Parameter | Region | Bias (%) | RMSE (%) |
|---|---|---|---|
| Hourly LW All-Sky Radiative Flux Mid-seasonal months 2019 NASA’s CERES SYN1deg (Ed4.1) | All Sites 60° Poleward 60° Equatorward | -0.6 2.0 -1.3 | 4.8 8.7 5.0 |
Comparison Plot: NASA’s CERES SYN1deg (Ed4.1) to BSRN Data: Longwave
Hourly validation covers Jan., Apr., Jul., and Oct. 2019.
FLASHFlux
There are many uses for the CERES data products on a near real time basis such as those referred to within the POWER Project. To meet those needs, FLASHFlux has greatly sped up processing by using the earliest stream of data coming from CERES instruments and using fast radiation algorithms to produce results within one week of satellite observations. This results in the loss of climate-quality accuracy due to bypassing some calibration checks, and some gaps in the earliest stream of satellite data. As such, the FLASHFlux provides global estimates of daily solar (shortwave) and thermal infrared (longwave) radiation fluxes for the time period covering the end of SYN1deg to within 1 week of real time. FLASHFlux is explicitly designed as the rapid-turnaround complement to the climate-quality CERES products, using preliminary calibration and fast parameterizations to achieve its low latency.
Both FLASHFlux and SYN1deg rely on similar input data sets from the meteorological products and Moderate Resolution Imaging Spectroradiometer (MODIS). It is important to note that the FLASHFlux endeavor intends to incorporate the latest input data sets (such as GEOS-5.12.4 FPIT meteorology instead of CERES G5.4) and improvements into its algorithms. However, there are no plans to reprocess the FLASHFlux data products once these modifications are in place. Thus, in contrast to the CERES SYN1deg data products, the FLASHFlux data products are not to be considered of climate quality. Users seeking climate quality should instead use the CERES SYN1deg and Energy Balanced and Filled (EBAF) data products. Because FLASHFlux is not reprocessed for consistency, the CERES team recommends SYN1deg and EBAF for any trend or climate-quality analysis.
For speedy retrieval of surface solar insolation, FLASHFlux uses the SW Model B that is also used in CERES processing (Kratz et al., 2010, 2014). This model is named the Langley Parameterized SW Algorithm (LPSA) and described in detail in Gupta et al., (2001). It consists of physical parameterizations which account for the attenuation of solar radiation in simple terms separately for clear atmosphere and clouds. Surface insolation, F_{sd}, is computed as:
The LW radiative fluxes are produced via the Langley Parameterized Longwave Algorithm (LPLA). Detailed descriptions of this algorithm can be found in Gupta et al., (1992); Gupta, (1989); and Wilber et al., (1999). The LPSA and LPLA parameterizations are the operational fast-flux algorithms underlying CERES FLASHFlux near-real-time surface fluxes (Kratz et al., 2014)
TODO[SOURCING|Medium]: add full peer-reviewed citations for Gupta et al. (2001, 1992), Gupta (1989), and Wilber et al. (1999).
The BSRN network provides the surface reference used in these FLASHFlux comparisons.
Comparison Plots: NASA’s FLASHFlux 4A to BSRN Data
Daily covers January through December 2025
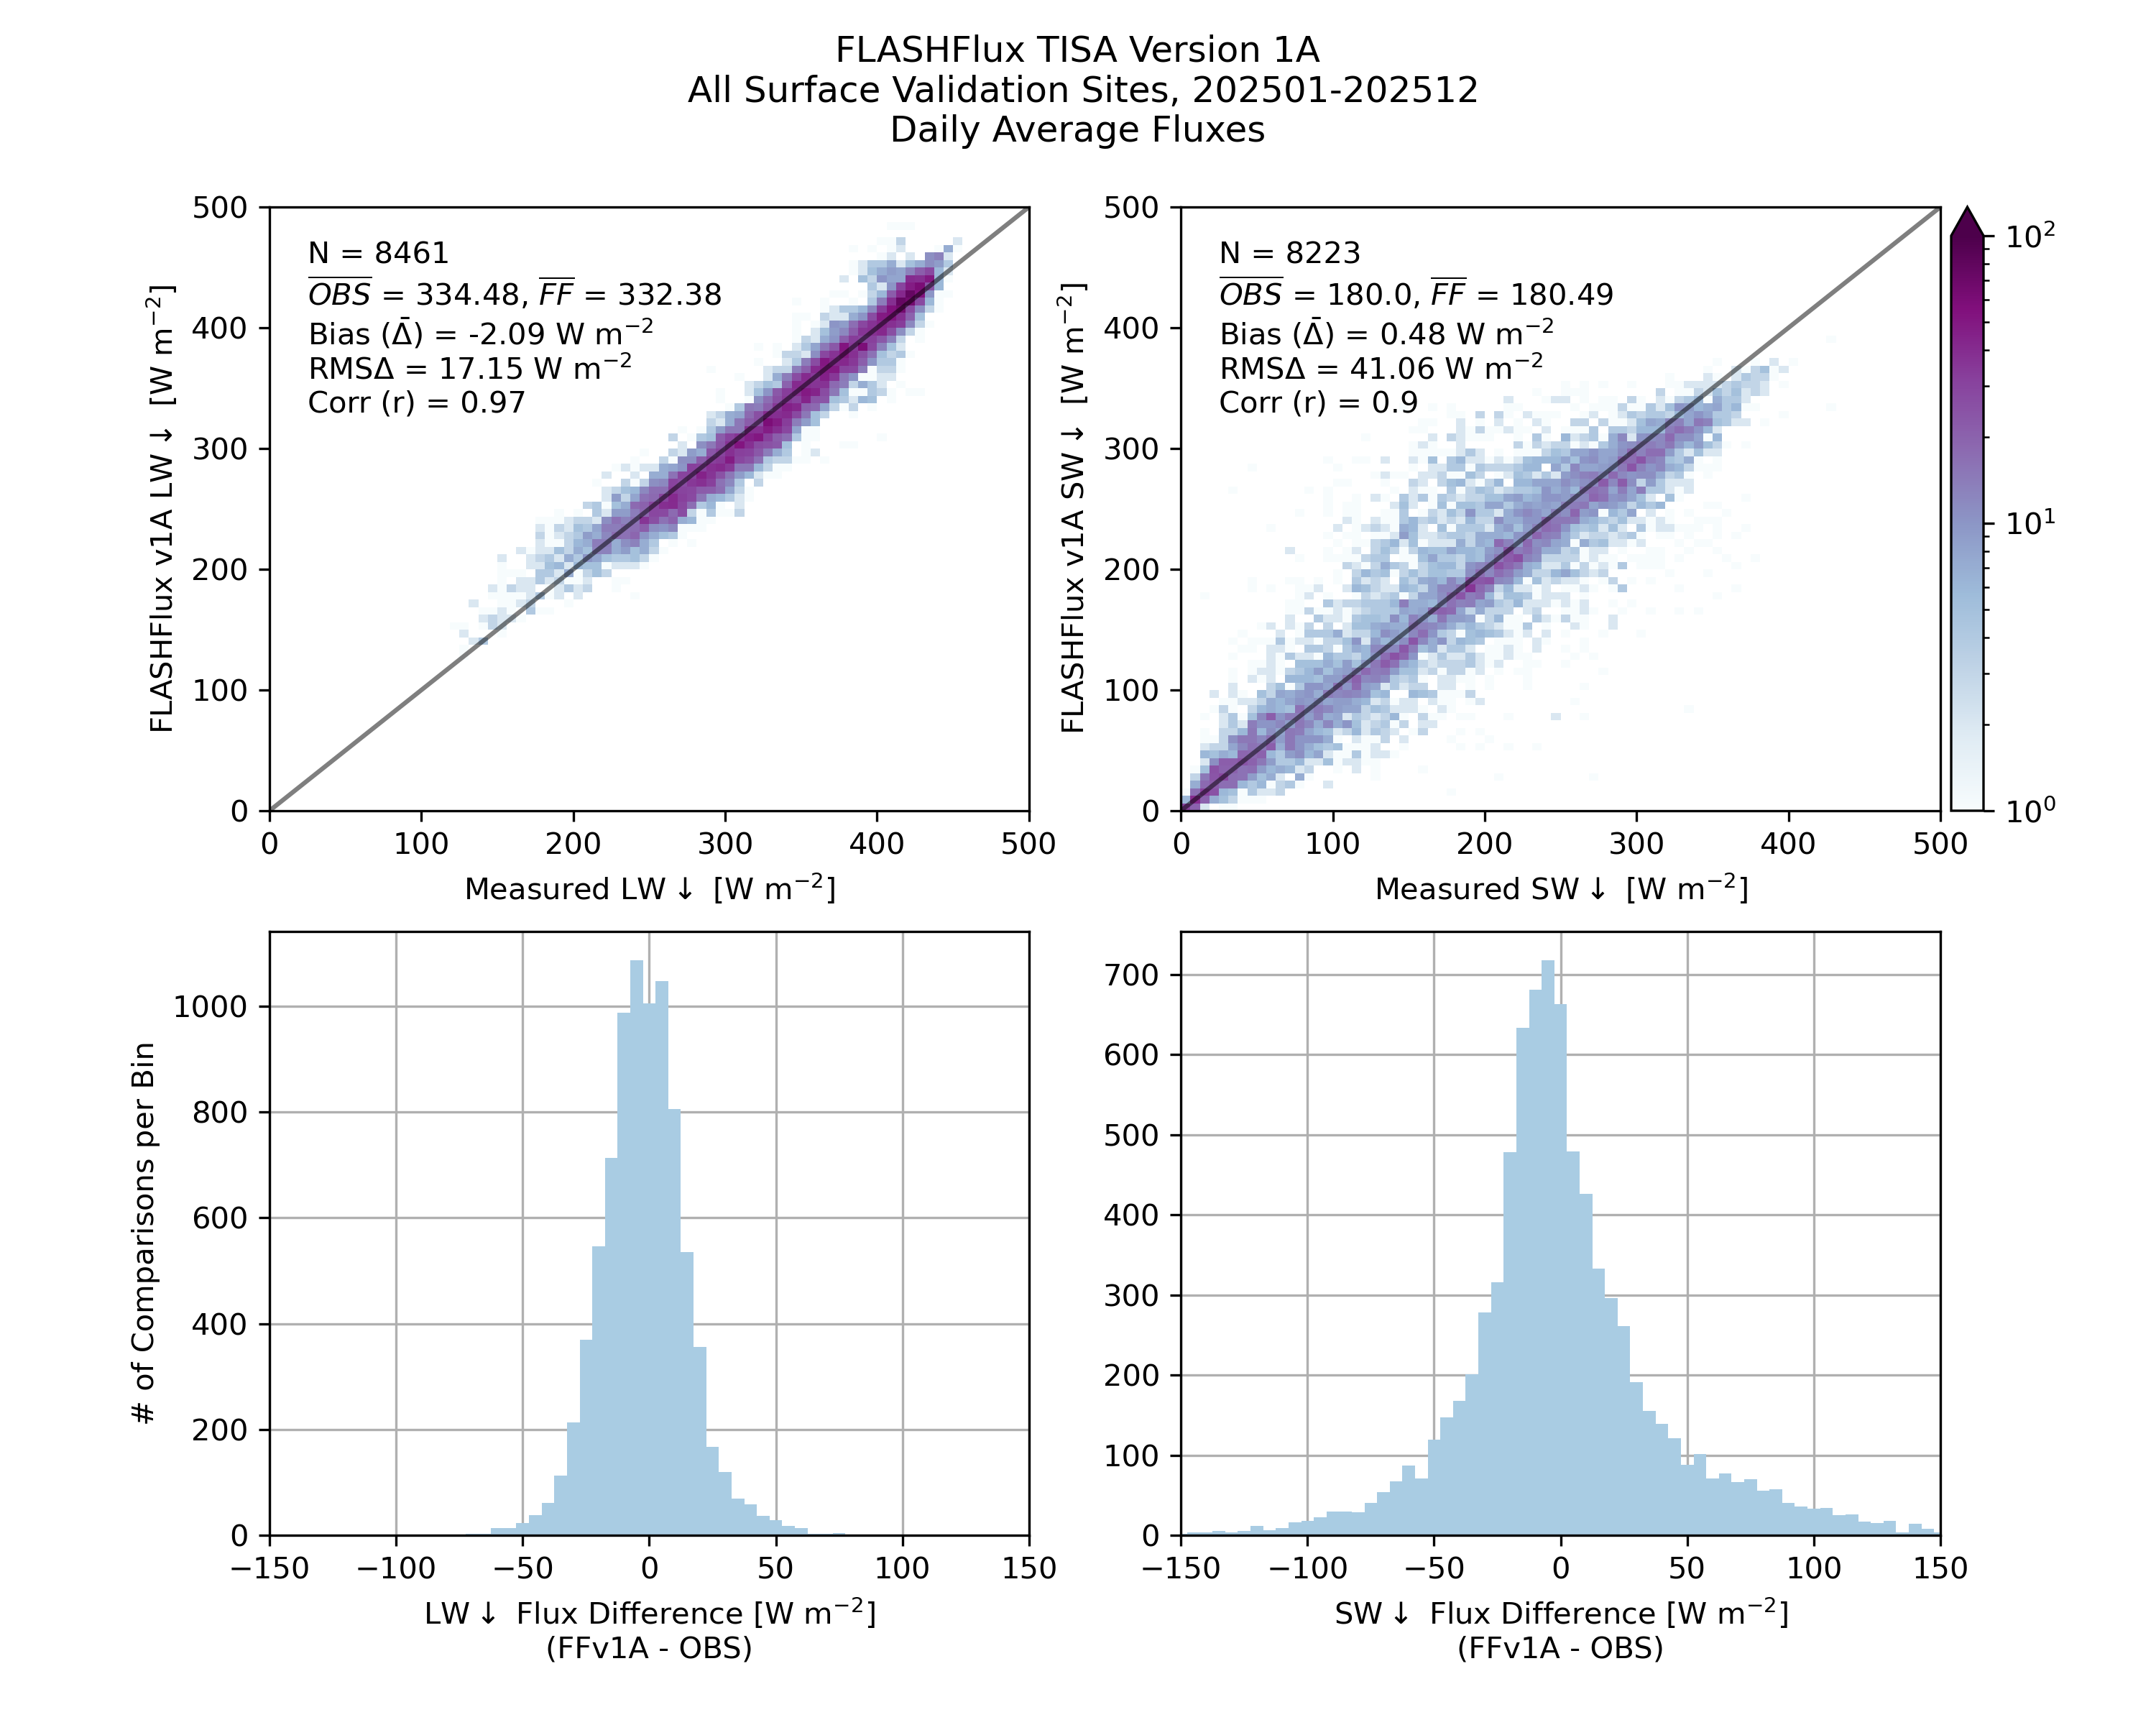
Daily: Scatter Density Plot (top), Histogram (bottom)