Clouds, Aerosols and Trace Gases
Cloud properties from POWER support a range of applications:
-
Solar energy: Clouds and aerosols are the two atmospheric constituents that determine how much of the top-of-atmosphere solar flux actually reaches to the surface. Both attenuate the direct beam and redistribute part of that energy into the diffuse field, so they govern not only total available irradiance but its partitioning between direct and diffuse components — the distinction that separates the resource seen by a concentrating system from that seen by a fixed-tilt array. Because their variability is the largest source of uncertainty in solar resource assessment, forecasting, and long-term yield estimation, cloud and aerosol properties are standard inputs to the irradiance models the solar community relies on. Gueymard, C.A. (2012) Sengupta et al., 2018
-
Building energy: Cloud cover influences heating and cooling loads through its effect on both shortwave and longwave radiation at the surface. Cloud information is used in building simulation tools for load calculations and for heating and cooling assessments, where the sky's radiative behavior depends on how much of it is obscured Evangelisti et al., 2019. POWER serves cloud amount and cloud optical depth from the CERES SYN1deg synoptic product, which resolves the surface radiation budget on a globally gridded, temporally complete basis Rutan et al., 2015.
-
Agriculture: Crop growth responds to the light reaching the canopy, and clouds are the dominant control on how much arrives and in what form. They reduce total photosynthetically active radiation (PAR) while raising the diffuse fraction, and diffuse light penetrates deeper into a canopy than direct beam, illuminating shaded leaves that would otherwise contribute little. Clouds also govern the surface energy balance terms that drive evapotranspiration and reference crop water demand. POWER's PAR parameters are retrieved from the CERES Surface and Atmospheric Radiation Budget product, which resolves the direct and diffuse components separately Su et al., 2007, using the cloud properties derived from imager radiances by the CERES cloud algorithm Minnis et al., 2021. The agronomic significance of the diffuse fraction is well documented Mercado et al., 2009; Kanniah et al., 2012, though the net effect on productivity weakens at broader scales because total PAR falls as cloud thickness rises Zhu et al., 2019.
SYN1deg
Cloud Amount and Cloud Optical Visible Depth are derived from NASA's CERES SYN1deg and are available to users at the Hourly, Daily, Monthly, Annual, and Climatology temporal levels.The CERES SYN1deg synoptic product combines CERES broadband measurements with cloud properties retrieved from MODIS and from geostationary imagers, the latter supplying the diurnal sampling that polar-orbiting satellites alone cannot provide, to produce temporally complete, globally gridded cloud and flux fields Rutan et al., 2015; CERES, 2024. As with the solar data, the cloud cover information is available in its original source spatial resolution. Cloud Optical Visible Depth is the vertical optical thickness between the top and bottom of a cloud as computed in the CERES algorithm. Cloud optical depth in CERES is retrieved from imager radiances using the CERES cloud-property algorithm, which derives optical thickness alongside cloud phase and effective particle size Minnis et al., 2011; Minnis et al., 2021.
The percentage of cloud cover is computed in the CERES algorithm. The percentage of cloud cover is computed on 1-hourly time increments for a given month and then averaged over the day to yield the daily averaged percentage for each temporal level. Additionally, the system provides hour-based cloud cover values for each temporal level for all GMT times.
Averaged Frequencies:
| Name | Definition |
|---|---|
| Daytime | Daytime hours only |
| Nighttime | Nighttime hours only |
| Clear Skies | Cloud Cover less than or equal to 10% |
| Broken-cloud Skies | Cloud Cover 10 – 70% |
| Near-overcast Skies | Cloud Cover greater than or equal to 70% |
The AOD parameters available through POWER are derived from NASA's CERES SYN1deg Edition 4.2 product. CERES SYN1deg incorporates MODIS-derived aerosol properties into its radiative transfer calculations, providing globally gridded AOD estimates at 1° latitude by 1° longitude spatial resolution. The MODIS aerosol retrievals underlying these calculations come from the Dark Target algorithm over land and ocean Levy et al., 2013 and the Deep Blue algorithm over bright surfaces Hsu et al., 2006. These merged retrievals are assimilated at 550 nm by the Model for Atmospheric Transport and Chemistry (MATCH), which supplies the aerosol field to the SYN1deg radiative transfer calculation. Fillmore et al., 2022
| Source | Spatial Resolution | Temporal Start | Temporal End |
|---|---|---|---|
| CERES SYN1deg Ed4.2 | 1° x 1° | January 1, 2001 | Near Real Time |
Parameters
The POWER project provides three AOD parameters:
| Parameter | Definition | Units |
|---|---|---|
| AOD_55 | The optical thickness at 0.55 µm measured vertically; the component of the atmosphere to quantify the removal of radiant energy from an incident beam. | dimensionless |
| AOD_84 | The optical thickness at 0.84 µm measured vertically; the component of the atmosphere to quantify the removal of radiant energy from an incident beam. | dimensionless |
| AOD_55_ADJ | The adjusted optical thickness at 0.55 µm measured vertically; the component of the atmosphere to quantify the removal of radiant energy from an incident beam. | dimensionless |
These parameters are available at the following temporal levels: Hourly, Daily, Monthly, Annual, and Climatology.
Adjusted AOD at 0.55 µm
The AOD_55_ADJ parameter represents an adjusted version of the 0.55 µm aerosol optical depth. This adjustment accounts for known biases in the satellite-derived AOD retrievals to provide improved agreement with ground-based observations. Satellite AOD retrievals are commonly bias-corrected against AERONET, the network that anchors the AOD reference scale used for such adjustments Holben et al., 1998; Levy et al., 2013.
Validation
The POWER science team validated the AOD parameters against ground-based observations from the AErosol RObotic NETwork (AERONET), a globally distributed network of sun photometers providing cloud-screened, quality assured spectral AOD. AERONET Level 2.0 direct-sun AOD carries an absolute uncertainty of roughly 0.01 at visible wavelengths, which is why it serves as the reference standard for satellite and reanalysis AOD Holben et al., 1998; Giles et al., 2019. AERONET sun photometers do not observe at 550 nm. Reference values are computed from the measured AOD at a neighboring channel using the Ångström power law Ångström, 1929:
where τ is aerosol optical depth, λ₁ is the wavelength of the measured AOD (870 nm), and α is the Ångström exponent derived over the 500–870 nm range.
Validation was performed at AERONET sites spanning a range of aerosol regimes. The comparison at Boulder, Colorado is shown below as a representative example; results for the full station set are consistent in character.
Users should note that SYN1deg AOD served through POWER is the aerosol field underlying POWER's CERES radiative flux parameters, ensuring internal consistency between the aerosol and flux products.
AOD at 0.55 µm
AOD at 0.55 µm Validation
Validation of CERES SYN1deg AOD at 0.55 µm against AERONET surface observations.
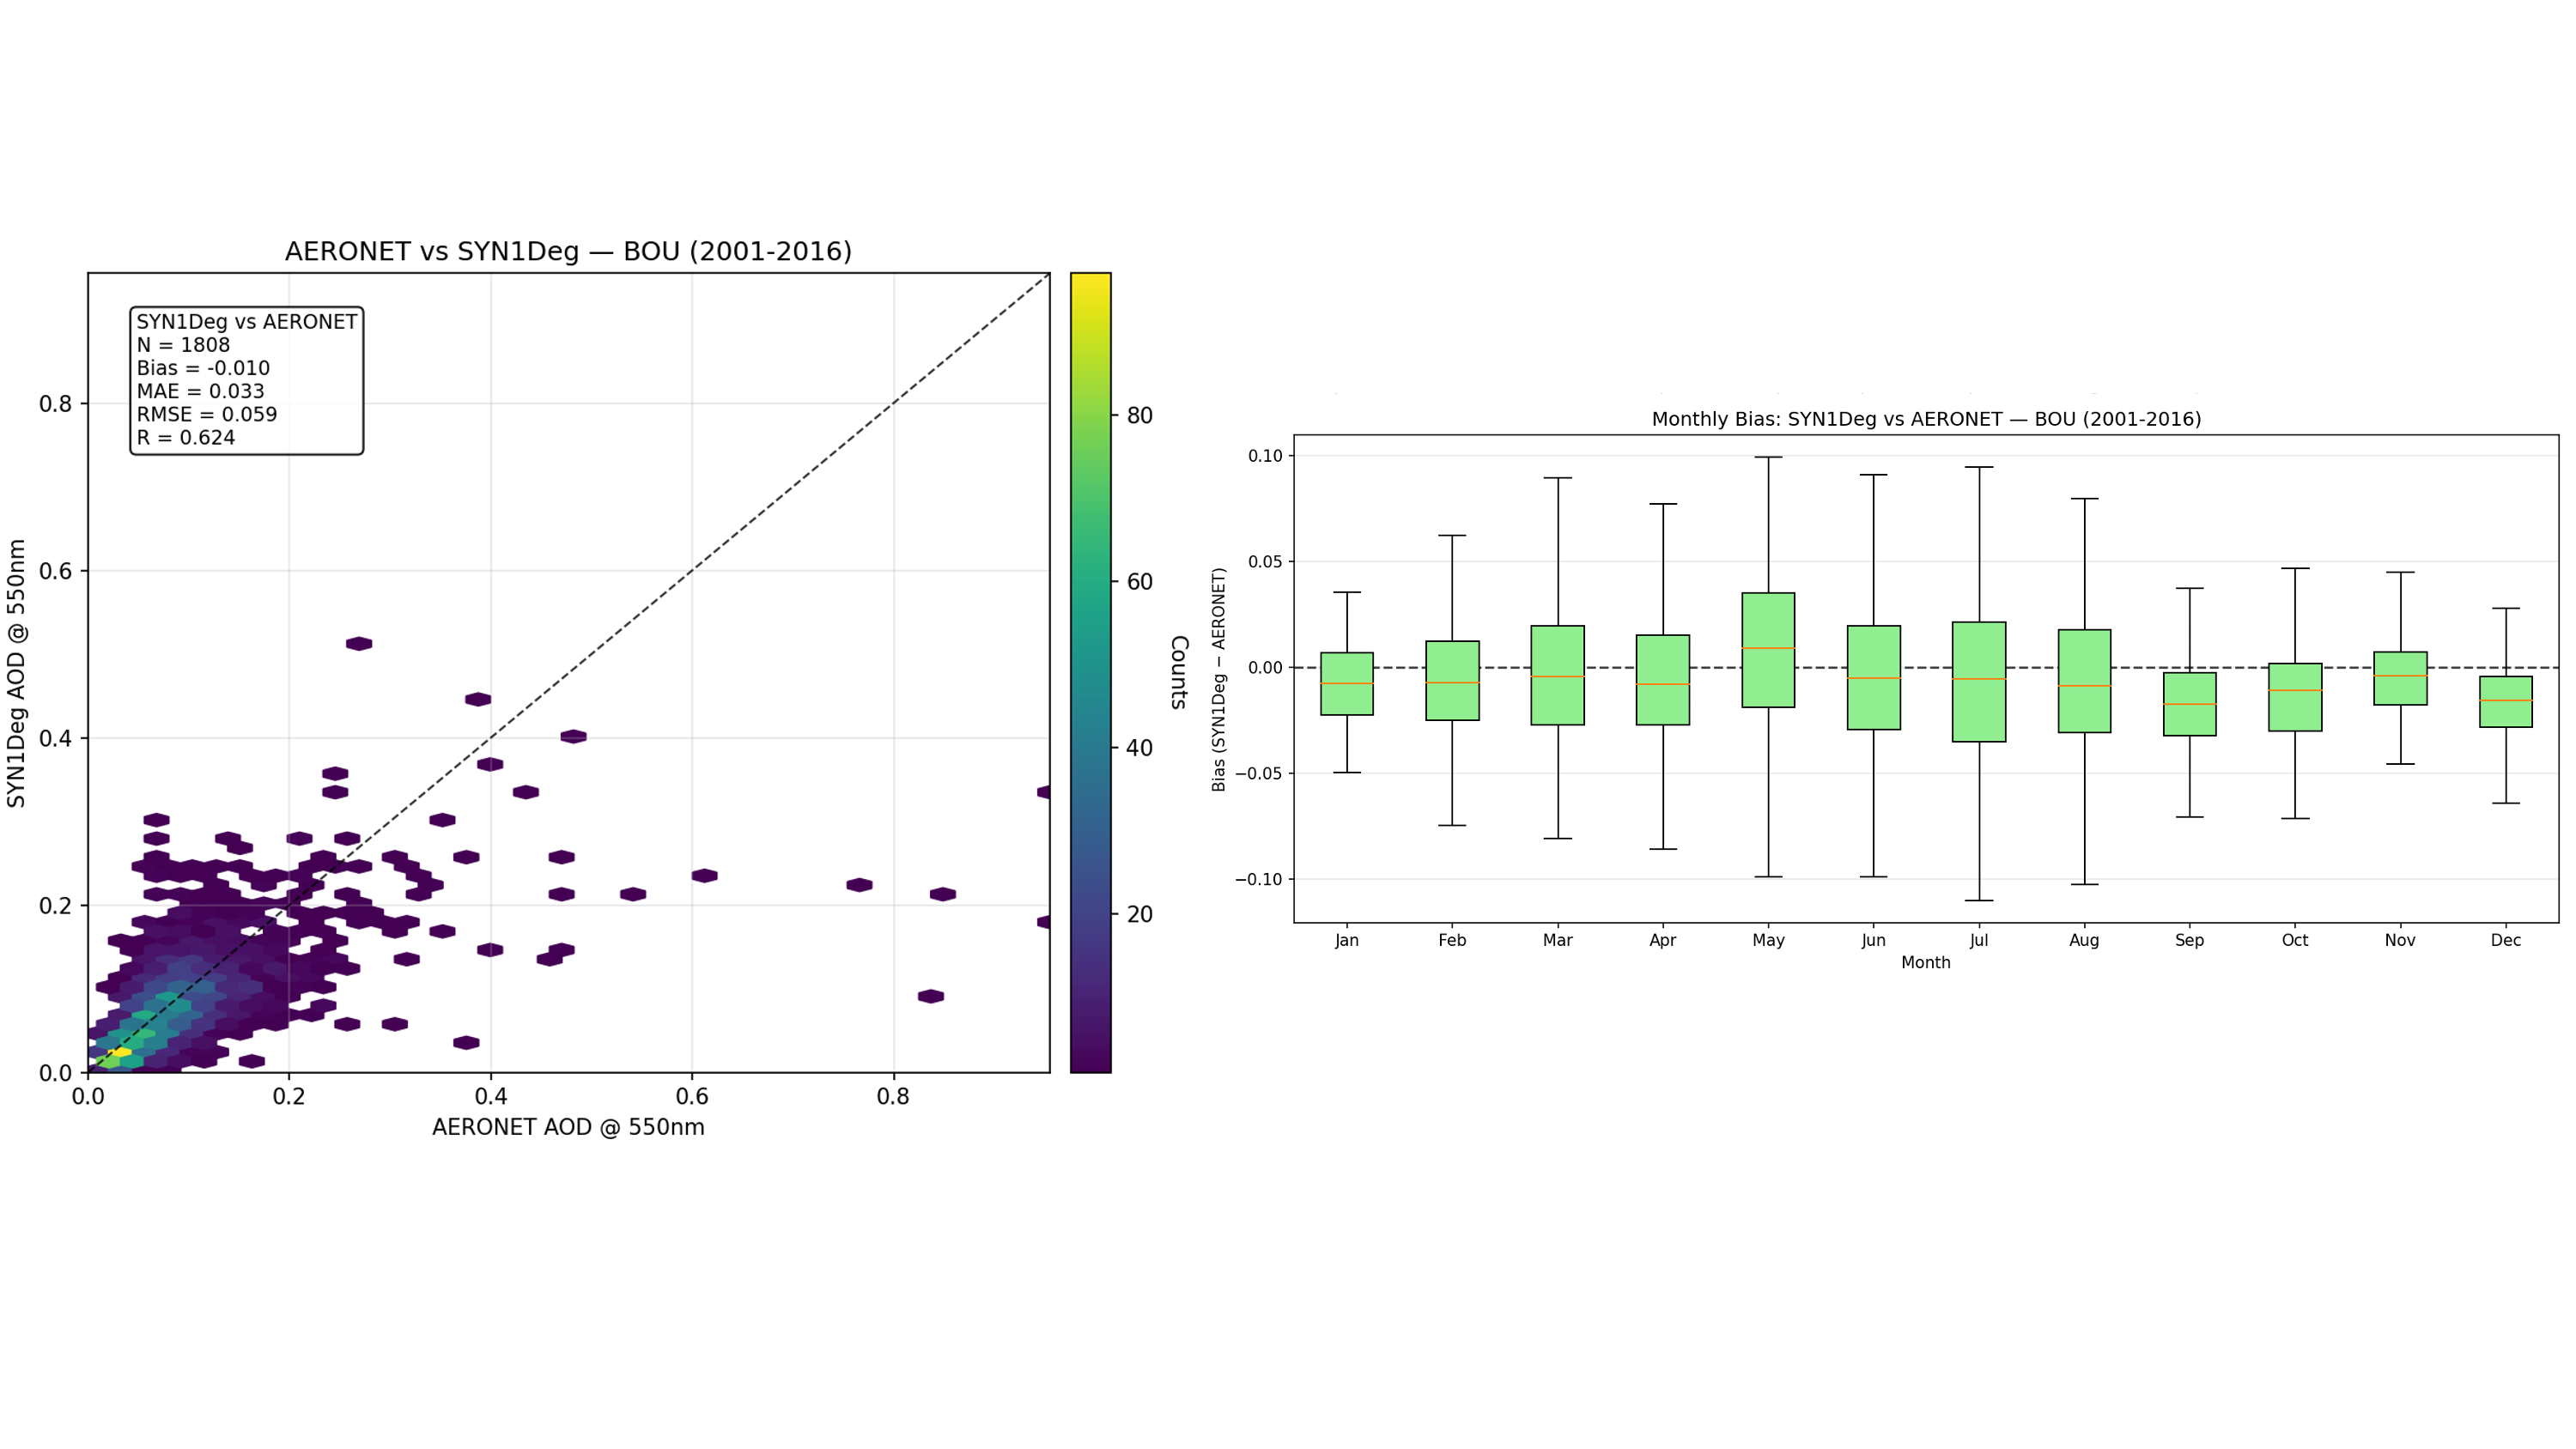
Comparison of CERES SYN1deg AOD at 550 nm against AERONET Level 2.0 observations at Boulder, Colorado (BOU), 2001–2016. Left: Hexbin scatter plots of matched pairs. Right: SYN1deg − AERONET difference by calendar month.
Plot Notes
- Statistics include bias, root mean squared error (RMSE), Pearson's correlation coefficient, Mean Absolute Error and number of matched data pairs.
- Validation comparisons utilize quality-assured Level 2.0 AERONET data matched spatially and temporally to the 1° SYN1deg grid.
TEMPO
The Trace Gas and Cloud parameters described below originate from NASA's TEMPO mission — Tropospheric Emissions: Monitoring of Pollution and are available at the Hourly, Daily, and Monthly temporal levels. TEMPO is a direct spectroscopic measurement from a single instrument. It is an ultraviolet-visible grating spectrometer, launched in April 2023 as NASA's first Earth Venture Instrument and the agency's first science payload hosted aboard a commercial communications satellite, Intelsat 40e Zoogman et al., 2017. From a geostationary position near 91°W, TEMPO holds a fixed view of North America and sweeps the continent from east to west roughly once per hour throughout daylight. TEMPO also observes at fine spatial scale. The instrument's native ground sample is roughly 2 km north-south by 4.7 km east-west near the center of the field of regard, sufficient to resolve gradients across individual neighborhoods, industrial corridors, and transportation routes that coarser products average away. Level 3 products which POWER serves are gridded at a uniform 0.02° × 0.02°, somewhat finer than the native footprint. TEMPO measures backscattered sunlight across 290–490 nm and 540–740 nm. Trace gas abundances are inferred from the distinctive absorption signatures each species imprints on that spectrum, using differential optical absorption spectroscopy. Because the technique depends on sunlight traversing the atmosphere and returning to the instrument, TEMPO observes only during daylight and only when the atmospheric column is substantially free of cloud. With the exception of the ozone profile, every TEMPO parameter reports a vertical column density: the total quantity of a gas within a vertical path through the atmosphere.
Parameters
| Parameter | Definition | Units |
|---|---|---|
| Tropospheric Nitrogen Dioxide Vertical Column | Tropospheric nitrogen dioxide vertical column from the TEMPO NO2 V04 Level 3 product | molecules/cm² |
| Tropospheric Nitrogen Dioxide Vertical Column Uncertainty | Uncertainty of the TEMPO tropospheric nitrogen dioxide vertical column | molecules/cm² |
| Tropospheric Nitrogen Dioxide Quality Flag | Main data quality flag from the TEMPO NO2 V04 Level 3 product | Dimensionless |
| Formaldehyde Vertical Column | Formaldehyde vertical column from the TEMPO HCHO V04 Level 3 product | molecules/cm² |
| Formaldehyde Vertical Column Uncertainty | Uncertainty of the TEMPO formaldehyde vertical column | molecules/cm² |
| Formaldehyde Quality Flag | Main data quality flag from the TEMPO HCHO V04 Level 3 product | Dimensionless |
| Surface Ozone Profile | TEMPO O3PROF V04 ozone profile selected at the lowest altitude layer | Dobsons |
| Surface Ozone Profile Precision | Precision of the TEMPO O3PROF V04 ozone profile at the lowest altitude layer | Dobsons |
| Surface Ozone Profile Error | Error of the TEMPO O3PROF V04 ozone profile at the lowest altitude layer | Dobsons |
| Cloud Amount | The average percent of cloud amount during the temporal period | % |
| Surface Pressure | The atmospheric pressure at the surface of the earth | hPa |
| Surface Albedo | Surface albedo from the TEMPO V04 Level 3 support data | Dimensionless |
| Solar Zenith Angle | The angle between the geodetic zenith vector and a vector from the earth point to the sun integrated over the period | Degrees |
| Cloud Pressure | Cloud pressure from the TEMPO CLDO4 V04 Level 3 product | hPa |
Note on Usage: Users should note that while Surface Ozone (O3_SFC) and Surface Pressure represent surface conditions, parameters like NO2_VCD and HCHO_VCD represent total quantities in the atmospheric column. While these column densities are strong indicators of localized surface emission patterns, they do not directly equate to surface-level mixing ratios (e.g., parts per billion) typically measured by ground sensors. For nitrogen dioxide, POWER distributes the tropospheric column, which excludes the stratospheric contribution and so isolates the portion of the atmosphere influenced by surface emissions.