Equatorward Tilted Surfaces
The Hourly GTI and GTrI and their daily and monthly means
The short time intervals of hourly GHI, DNI and DHI make it suitable for estimating hourly global tilted irradiances (GTI) on tilted panels. The angle of incidence on an arbitrarily oriented surface is a result of solar geometry, expressed through the surface tilt, surface azimuth, solar zenith, and solar azimuth angles Duffie & Beckman, 2013; Braun & Mitchell, 1983. When the tilt angle 𝛽 and azimuth angle 𝛾 are given, they can be used along with the solar zenith angle Z and 𝛾s to calculate the incident angle 𝜃 as follows:
The formula for the isotropic model is then used to calculate the hourly GTI as follows:
where IT is the hourly GTI, In is the hourly DNI, Id is the hourly DHI, I is the hourly GHI and 𝜌s is the hourly ground surface albedo. The isotropic transposition model assumes diffuse sky radiation is uniformly distributed over the sky dome and adds a ground-reflected term scaled by the surface view factor, making it the simplest and most widely used transposition approach Liu & Jordan, 1960; Duffie & Beckman, 2013.
The GTI is provided for five (5) tilt angles at each location: 0°, |ϕ|-15°, |ϕ|, |ϕ|+15° and 90°. When |ϕ|-15°<0°, it means the tilt is away from the equator.
The global irradiance on a dual-axis tracker (GTrI) can easily be obtained by setting 𝜃 = 0, 𝛽 = Z, and 𝛾 = 𝛾s in the above two equations. A dual-axis tracker continuously orients the surface normal toward the Sun so the beam angle of incidence is zero, which maximizes intercepted irradiance and is the standard idealized tracking case in solar geometry Braun & Mitchell, 1983; Duffie & Beckman, 2013.
When the hourly GTI and GTrI are available, the daily and monthly mean GTI and GTrI are obtained simply by averaging the hourly means accordingly.
Tables 4 and 5 are comparison statistics of the hourly, daily and monthly GTI and GTrI, respectively, with the BSRN data. The tilt angle for the GTI here is |ϕ|. The Baseline Surface Radiation Network (BSRN) provides high-accuracy, quality-controlled surface radiation measurements that serve as a reference standard for validating satellite-derived irradiance products Driemel et al., 2018. The underlying corrected fluxes are derived from the CERES SYN1deg product CERES SYN1deg Ed4.1; Zhang et al., 2024a.
The bias-correction methodology applied to the hourly DHI and DNI prior to transposition is documented in the peer-reviewed derivation paper Zhang et al., 2024a; CERES SYN1deg Ed4.1.
Figs. 1-4 are about the hourly and monthly mean comparisons with the BSRN for DNI, DHI, GTI and GTrI.
| Time Scale | Bias | RMS | ρ | σ | μDATA | N |
|---|---|---|---|---|---|---|
| GTI on Equatorward Tilted Surfaces [tilt angle = abs(latitude)] | ||||||
| Hourly | 0.70 | 114.16 | 0.9358 | 114.16 | 370.89 | 3,315,300 |
| Daily | 0.63 | 32.78 | 0.9743 | 32.78 | 194.17 | 257,719 |
| Monthly | 0.72 | 13.48 | 0.9852 | 13.46 | 188.84 | 7,137 |
Table 4. CERES SYN1deg (ED4.1)-BSRN comparison of GTI on Equatorward tilted surfaces from 2000–04 to 2020–12 after the bias correction has been performed on the original hourly DHI and DNI. The tilt angle is equal to the absolute value of the latitude where the tilted surface is located. The definitions of symbols are the same as in Table 1. Zhang et al., 2024a; Driemel et al., 2018.
| Time Scale | Bias | RMS | ρ | σ | μDATA | N |
|---|---|---|---|---|---|---|
| GTrI on a Dual-Axis Tracking Panel (Tracker) | ||||||
| Hourly | 1.23 | 163.68 | 0.8981 | 163.67 | 480.71 | 3,315,543 |
| Daily | 0.91 | 51.37 | 0.9457 | 51.36 | 250.73 | 257,719 |
| Monthly | 0.91 | 21.06 | 0.9831 | 21.04 | 241.80 | 7,137 |
Table 5. CERES SYN1deg(ED4.1)-BSRN comparison of GTrI on a dual-axis tracking panel (tracker) from 2000–04 to 2020–12 after the bias correction has been performed on the original hourly DHI and DNI. The definitions of symbols are the same as in Table 1. Zhang et al., 2024a; Driemel et al., 2018.
Hourly and Monthly mean comparisons with BSRN
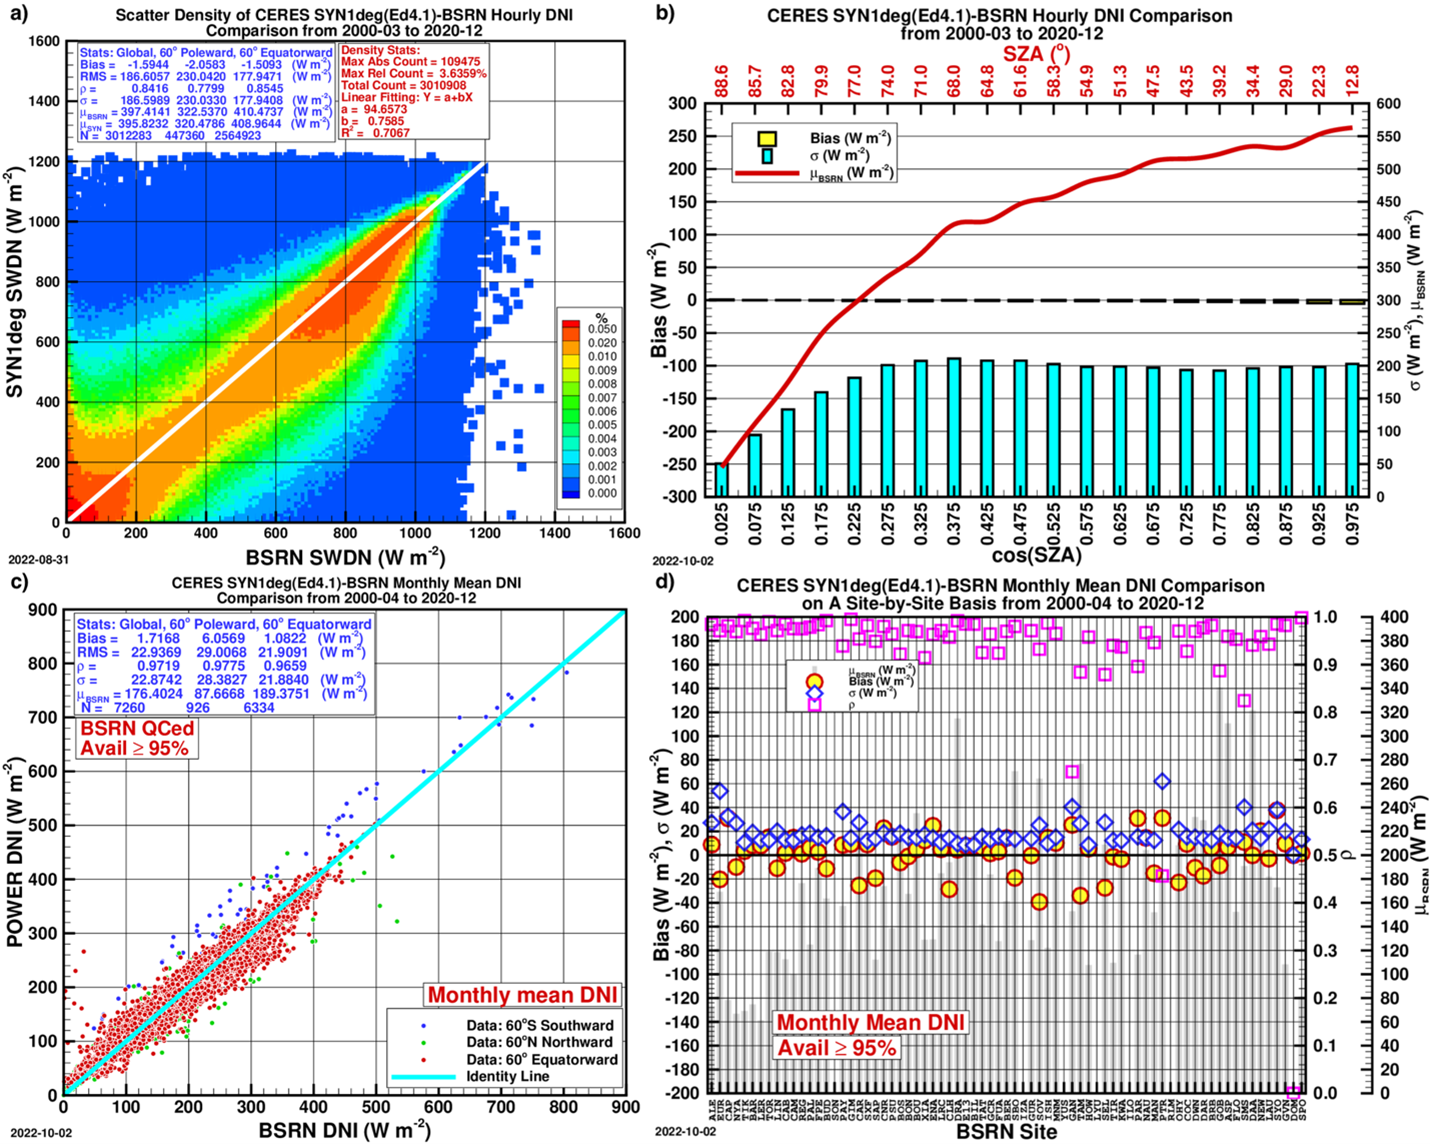
Figure 1. The CERES SYN1deg(Ed4.1) hourly DNI (labeled SWDN) after correction in comparison with the BSRN data. a) The scatter density plot. The comparison statistics are given for Global (all data points combined), 60° poleward, and 60° equatorward; σ stands for standard deviation, ρ for correlation coefficient, μBSRN for mean BSRN DNI, and μSYN for mean corrected DNI; b) Bias, σ and μBSRN in 20 equal-sized bins of cos(SZA); c) Scatter plot of monthly mean corrected DNI; d) Comparison on a site-by-site basis.
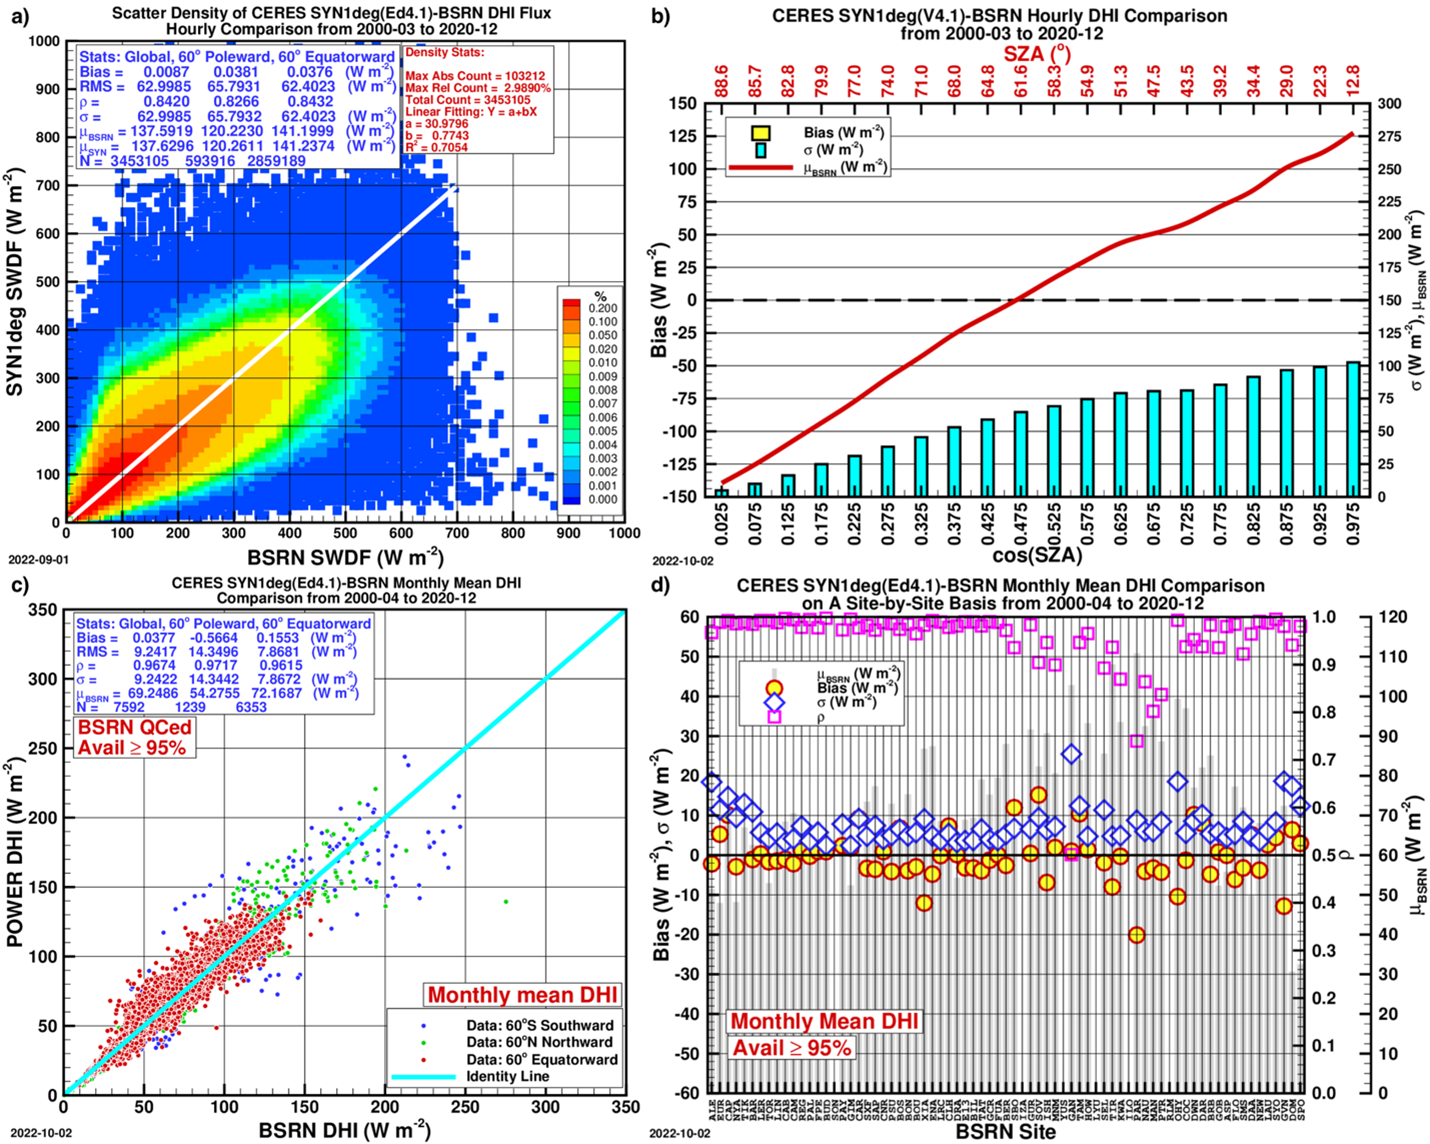
Figure 2. Same as Figure 1 except for corrected hourly DHI.
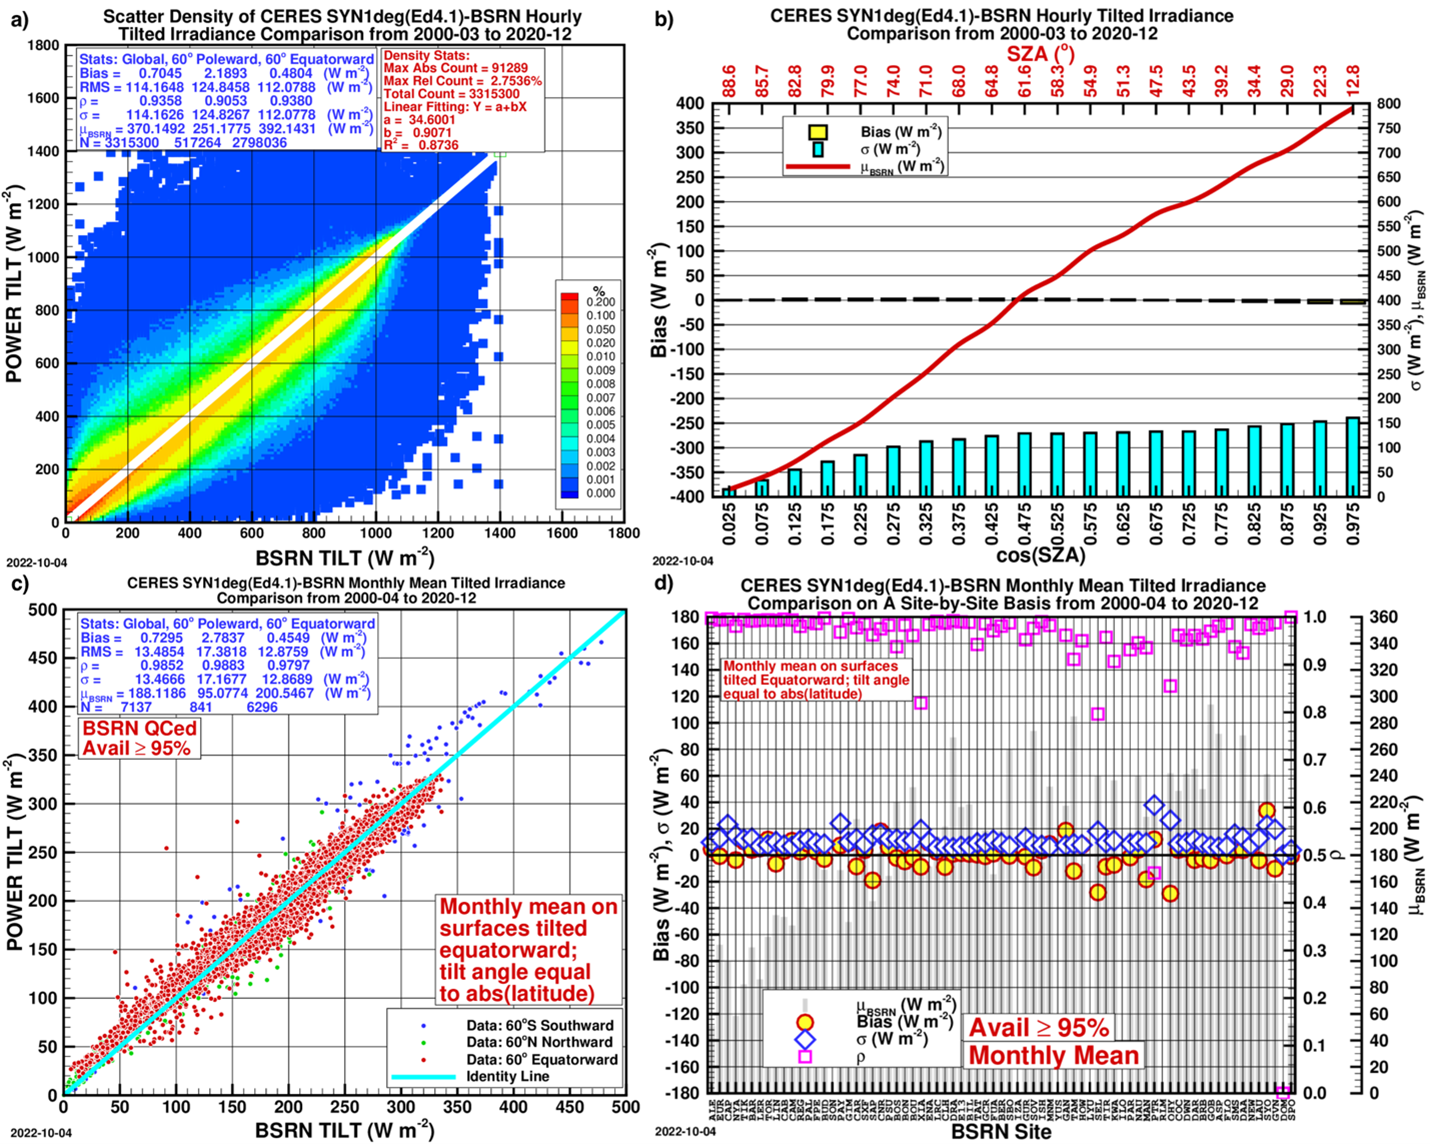
Figure 3. Same as Figure 1 except for GTI. At each site the surface is tilted equatorward, and the tilt angle is equal to the absolute value of its latitude.
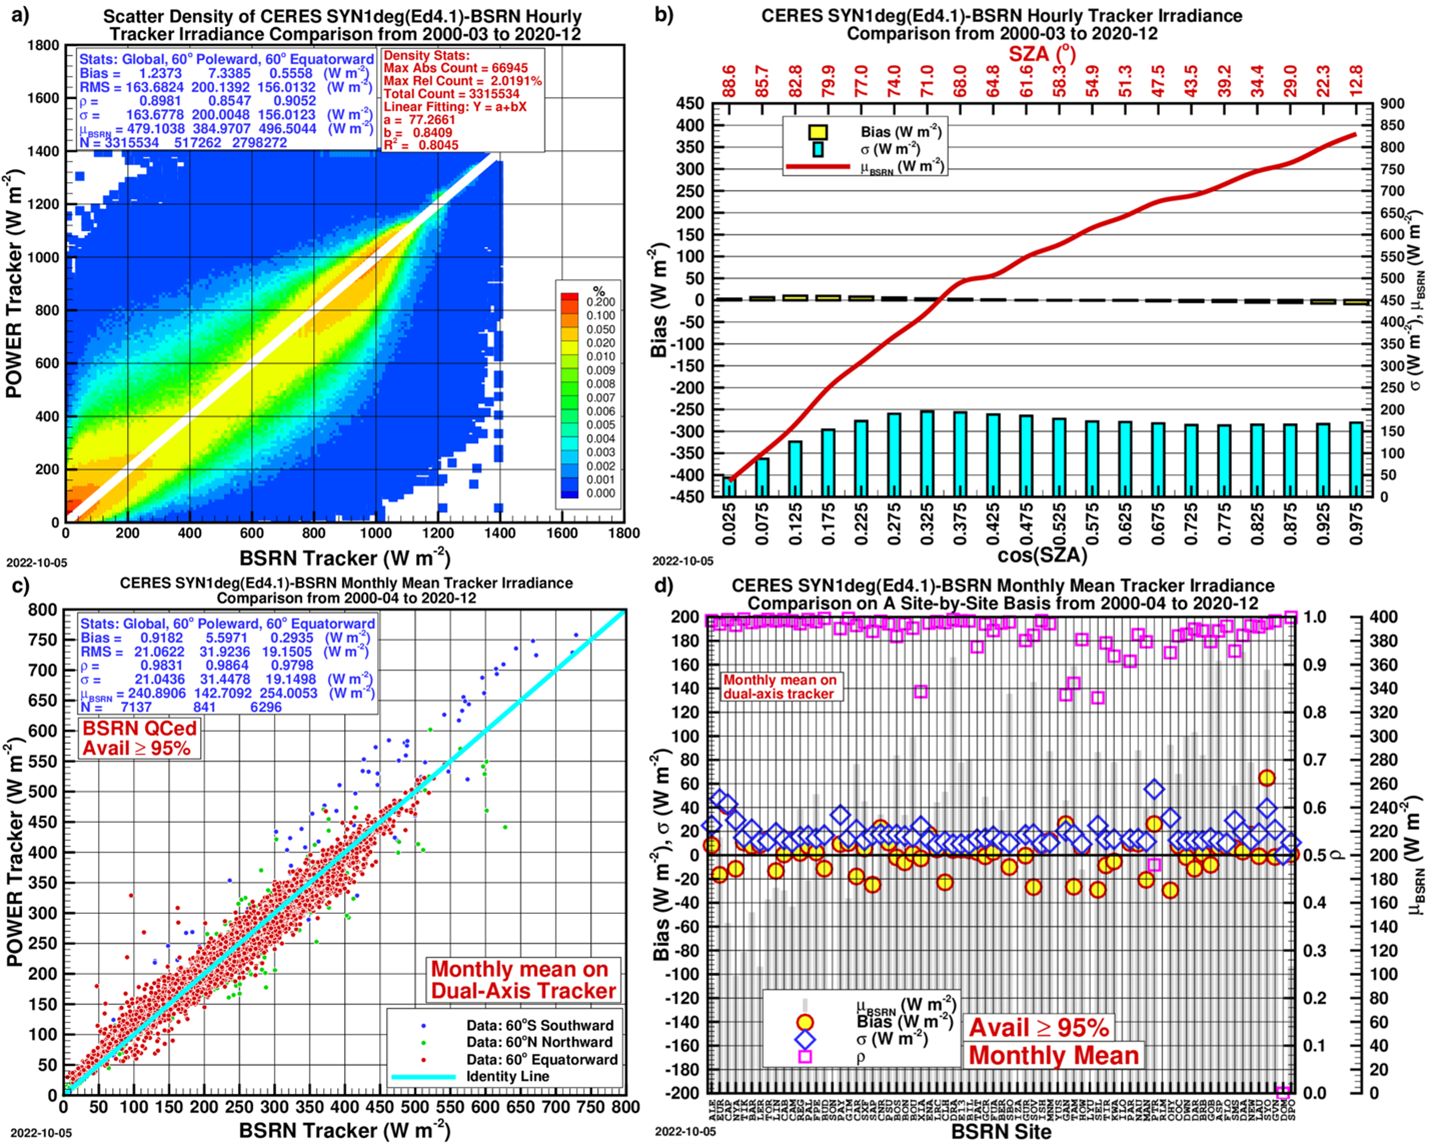
Figure 4. Same as Figure 1 except for GTrI on dual-axis trackers.
The CERES SYN1deg related energy fluxes have been updated to Ed4.2, but some validation results remain to be from Ed4.1, such as the validation of GTI and GTrI. They will be updated to Ed4.2 as they become available. Since the change of CERES SYN1deg from Ed4.1 to Ed4.2 is minimal, the changes in validation statistics are also minimal.
The Hourly irradiances on single-axis trackers
The dual-axis solar irradiance trackers can intercept the maximum possible solar irradiance, but the lower cost of equipment and maintenance of single-axis trackers make the latter more popular. Single-axis trackers reduce the angle of incidence along one rotational degree of freedom and are widely deployed in utility-scale photovoltaic systems because of their lower capital and operating costs relative to dual-axis systems Braun & Mitchell, 1983; Duffie & Beckman, 2013.
The available hourly GHI, DNI and DHI can be used to calculate the hourly global irradiance on various single-axis trackers on an hourly basis. Specifically, the system provides the hourly global irradiance for four typical kinds of single-axis tracker along with the hourly tilt angle 𝛽 and azimuth angle 𝛾 of the panel along with the rotation angle of the panel Ω relative to its axis. The rotation angle is used for active control of the panel.
This documentation uses the most popular east-north-up (ENU) local tangent plane coordinate system in which x-positive axis points to the east, y-positive axis points to the north, and z-positive axis points upward.
HSAT E-W
The horizontal single-axis tracker whose axis aligns with the east-west direction. The positive direction of the axis is assumed to point to the east, or the x-positive direction. Defining a positive direction of an axis makes it possible to determine the sign of the rotation angle. The right-hand rotation is defined as negative, and left-hand rotation positive. The tilt angle is equal to the absolute value of the rotation angle.
HSAT N-S
Horizontal single-axis tracker whose axis aligns with the north-south direction. The positive direction of the axis points to the north, or the y-positive axis. The tilt angle is also equal to the absolute value of the rotation angle.
PSAT
The polar single-axis tracker whose axis is parallel to the Earth’s rotation axis. An interesting feature of this configuration is that its rotation angle Ω is always equal to the hour angle 𝜔, and the incident angle of the direct sunlight is equal to that of the declination of the Sun everywhere. This means a PSAT always receives 91% or more of the direct sunlight. This is because on PSAT, the incident angle of the direct sunlight is in the range from 0 to 23.5 deg, and cossine of 23.5 deg is 0.91, or 91%. Because the polar (equatorial-mount) single-axis is aligned with the Earth's rotation axis, the beam angle of incidence equals the solar declination, which bounds the cosine projection loss across the year Braun & Mitchell, 1983; Zhang et al., 2025.
VSAT
The vertical single-axis tracker whose axis is perpendicular to the horizontal ground. The positive direction of the VSAT is upward. The tilt angle of a VSAT is always 90°, and its rotation angle is always equal to the solar azimuth angle.
Since a single-axis tracker seeks to minimize the incident angle of the direct sunlight at any instant, one can evaluate its performance by investigating how much direct insolation it can receive in time and space. This calculation may clarify how the different kinds of single-axis trackers compare to each other at different latitudes. The comparative performance of the five single-axis tracker configurations at both the top of atmosphere and the surface is derived from a vector-based universal solar-geometry formulation Zhang et al., 2025; Braun & Mitchell, 1983.
More information about single-axis trackers is available in Zhang et al., (2025).
Solar Geometry Temporal Availability
The original CERES SYN1deg hourly does provide hourly solar zenith angle which is a useful parameter as far as as the solar radiation on the horizontal surface is concerned. CERES SYN1deg, however, does not provide the corresponding hourly solar azimuth angle which is required when global tilted irradiance is concerned. In POWER, the hourly solar azimuth angle is calculated using the formula in Zhang et al. (2021). The user can use the same formula to calculate the solar zenith angle and solar azimuth angle. Daily mean solar zenith angle and solar azimuth angle are not very useful when daily mean solar irradiances are concerned. The user, however, can use the mentioned formula to calculate the solar zenith angle at local solar noon, for example.
References
Zhang, T., Stackhouse, Jr., P.W., Macpherson, B., and Mikovitz, J.C., 2024a. A CERES-BasedDataset of Hourly DNI, DHI and Tilted Irradiance on Equatorward Tilted Surfaces: Derivation and Comparison with the Ground-Based BSRN Data. Solar Energy, 274 (2024) 112538. https://doi.org/10.1016/j.solener.2024.112538
Zhang, T., Stackhouse, Jr., P.W., Patadia, F., Aluru, N., Macpherson, B., and Mikovitz, J.C., 2025. A Vector-Based Universal Formula for the Solar Geometry of Single-Axis Trackers: Application to Five Typical Kinds and Their Performance at TOA and Surface in Time and Space. Solar Energy, 302 (2025) 114015. https://doi.org/10.1016/j.solener.2025.114015