Solar Irradiance Data Sets Changes and Updates (Bias Correction of SRB Data)
POWER provides irradiance data sets that are derived from NASA's Global Energy and Water Cycle Experiment Surface Radiation Budget (GEWEX SRB) Project Release 4-Integrated Product (R4-IP) archive and NASA's Clouds and the Earth's Radiant Energy System CERES SYN1deg. The POWER merges these data sets into a single, temporally continuous archive. The GEWEX SRB R4-IP archive provides long-term, globally gridded surface radiative fluxes derived from satellite observations and reanalysis inputs. The CERES SYN1deg product combines CERES, MODIS, and geostationary imager data to produce computed surface and top-of-atmosphere fluxes at 1° resolution.
Solar Irradiance Source and Availability
| Source | Temporal Coverage Start | Temporal Coverage End |
|---|---|---|
| GEWEX SRB R4-IP | January 1, 1984 | December 31, 2000 |
| CERES SYN1deg Ed.4.2 | January 1, 2001 | NRT minus ~3–4 months |
Source and availability of the POWER solar irradiance inputs GEWEX SRB R4-IP; CERES SYN1deg).
A systematic bias was reported between these two data sets while they were merged together in the year 2001. Discontinuities of this kind have direct consequences for communities that rely on these data for solar energy system design, agricultural planning, and climate modeling. To obtain a consistent climate data record spanning the entire observational period, a quantile mapping bias correction was implemented. Quantile mapping adjusts a candidate distribution to match a reference distribution and is a widely used statistical transformation for bias-correcting climate variables Gudmundsson et al., 2012. Quantile-mapping variants are effective at correcting distributional biases, including extremes, relative to simple mean or variance scaling Cannon et al., 2015. For each 1° latitude by 1° longitude grid box across the globe, the algorithm matches the Cumulative Distribution Function’s (CDF) of the reference data set (CERES SYN1deg) to that of the SRB data set - the CDF being the probability that a value falls at or below a given threshold - thereby, adjusting the irradiance values to match the empirical distribution of two different measurements. CERES SYN1deg is taken as the reference for the correction because it agrees more closely with surface observations Rutan et al. (2015). The CERES SYN1deg and SRB irradiance have overlapping daily data from the time period 2001 to 2009 and this overlapping data set is used for training bias correction model.
The bias corrected solar irradiances has improved accuracy and reliability especially for the weather conditions associated with high cloud cover and extreme values. The all-sky surface longwave downward irradiance, all-sky surface shortwave downward irradiance, clear-sky surface shortwave downward irradiance and clear-sky surface longwave downward irradiance for the time period before 2001 has been adjusted for the POWER V10 Data.
Example: The plot shown in Figure 1 shows the mean difference between the CERES and SRB clear-sky longwave irradiance for overlapping time period. Though the data set exhibits a systematic bias globally the magnitude of differences between SRB and SYN1deg vary across each grid box. The global map after the correction is shown in Figure 2, where the bias has been significantly eliminated. Using the same trained model, the SRB data are adjusted before the year 2001 (i.e., 1984–2001).
Global maps of mean difference between SYN1deg and SRB before and after bias correction for Clear-Sky Downward Longwave Irradiance
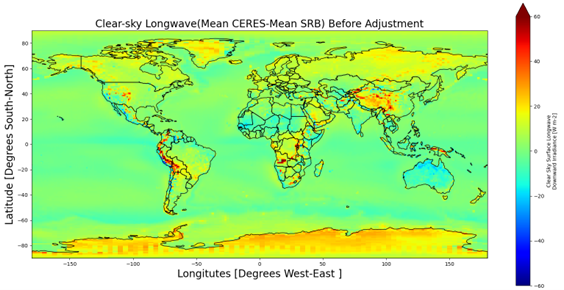
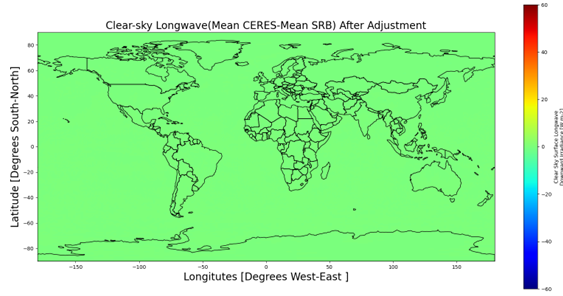
Figures 1–2: Global mean difference between CERES SYN1deg and GEWEX SRB clear-sky longwave downward irradiance before and after quantile-mapping bias correction.
Validation
To see how the quantile mapping adjustment changes the SRB data, the original and adjusted data are compared with the Baseline Surface Radiation Network (BSRN) data. The BSRN provides high-quality, research-grade surface radiation measurements widely used as a reference for validating satellite-derived irradiance Driemel et al., 2018. Figures 3 and 4 show the comparison of the SRB daily mean longwave irradiances with their BSRN counterparts before and after the quantile mapping adjustment from 1992 to 2000. The statistics show that the adjusted data agree with the BSRN data better in all three categories, namely, “Global”, “60° poleward” and “60° equatorward”, and the best improvement occurs at sites “60° equatorward”, and this is the zone the most site-months of BSRN data were recorded. Validation over this pre-correction period (1992–2000), independent of the 2001–2009 training window, shows the 60° equatorward mean bias in longwave flux reduced from 3.57 to 2.29 W m⁻² and the mean bias in daily-mean SRB shortwave flux against BSRN reduced from 3.49 to 0.7 W m⁻² (not shown here), confirming improved agreement across both flux components following adjustment.
Validations of the original and corrected SRB (V4.0-IP) daily mean longwave downward irradiance from 1992 to 2000.
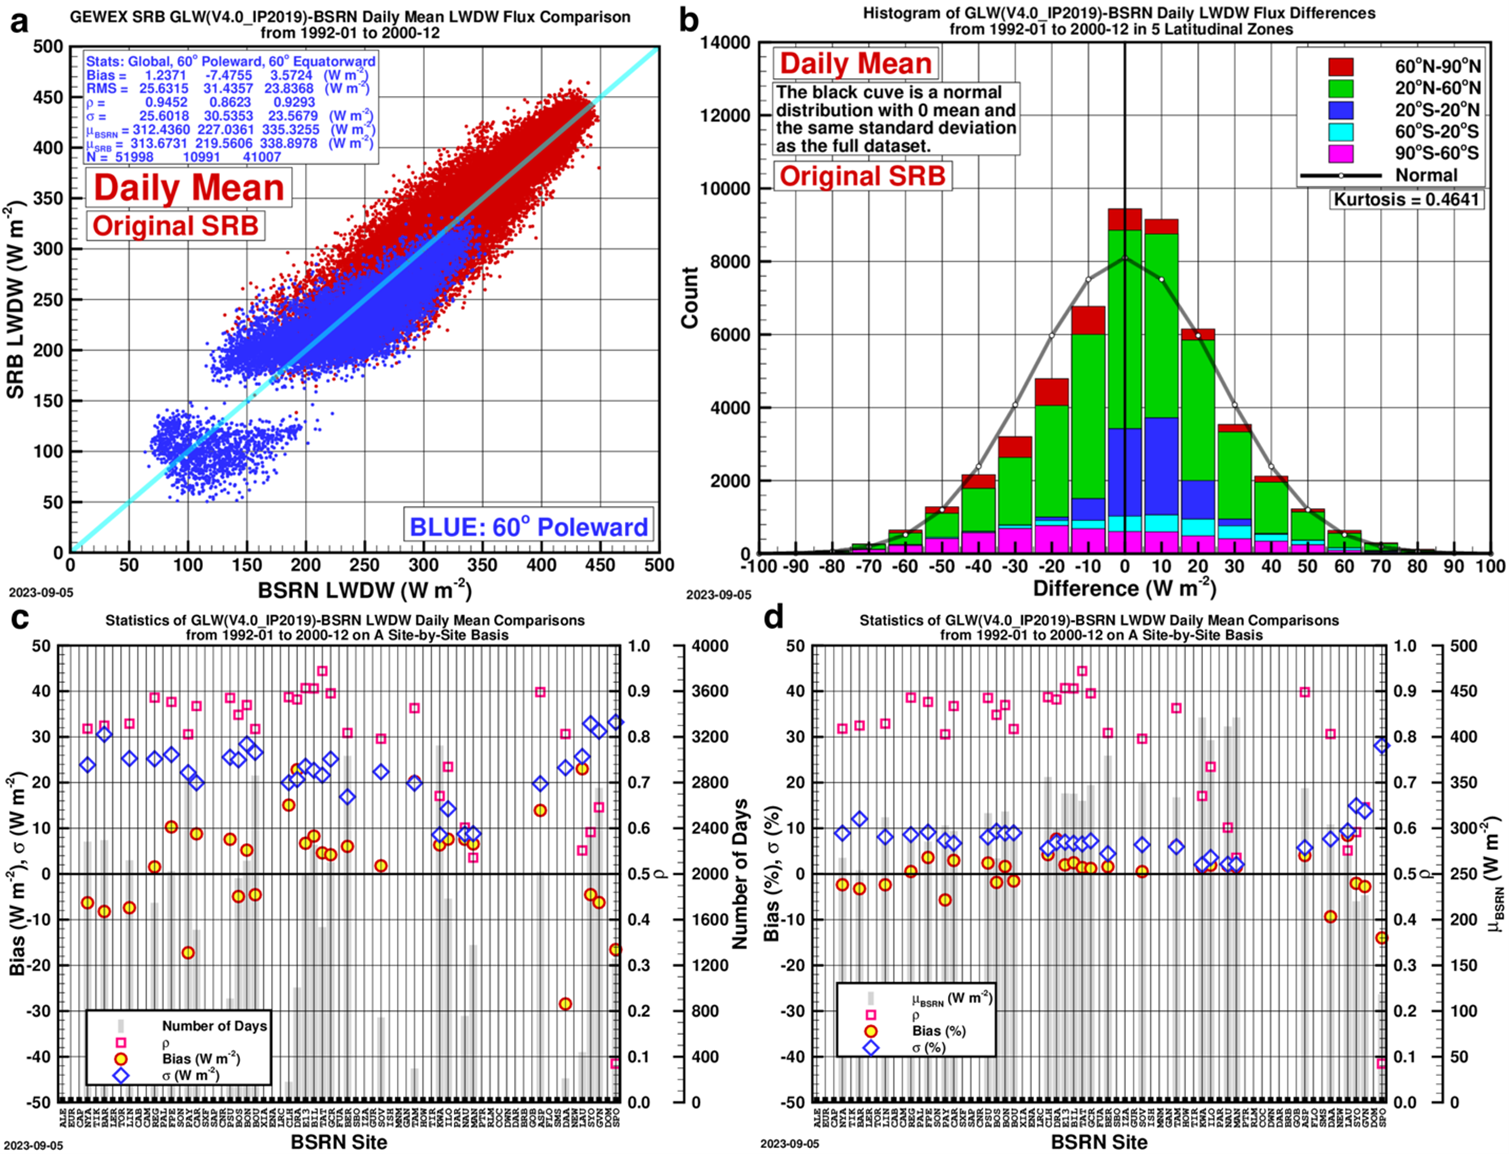

Figures 3–4: Daily mean SRB longwave downward irradiance versus BSRN observations (1992–2000), original and quantile-mapping corrected (BSRN reference).
Based on validation efforts that have been carried out for both longwave all-sky downward irradiance and shortwave all-sky downward irradiance (not shown here), it can be concluded that the bias-corrected data agree better with the ground-based BSRN data.