Gallery
This section provides a gallery the POWER's maps, graphs, and other visual products.
Map Templates
Standardized Map Templates that are used in both Static Maps and Time-Enabled Video Maps.
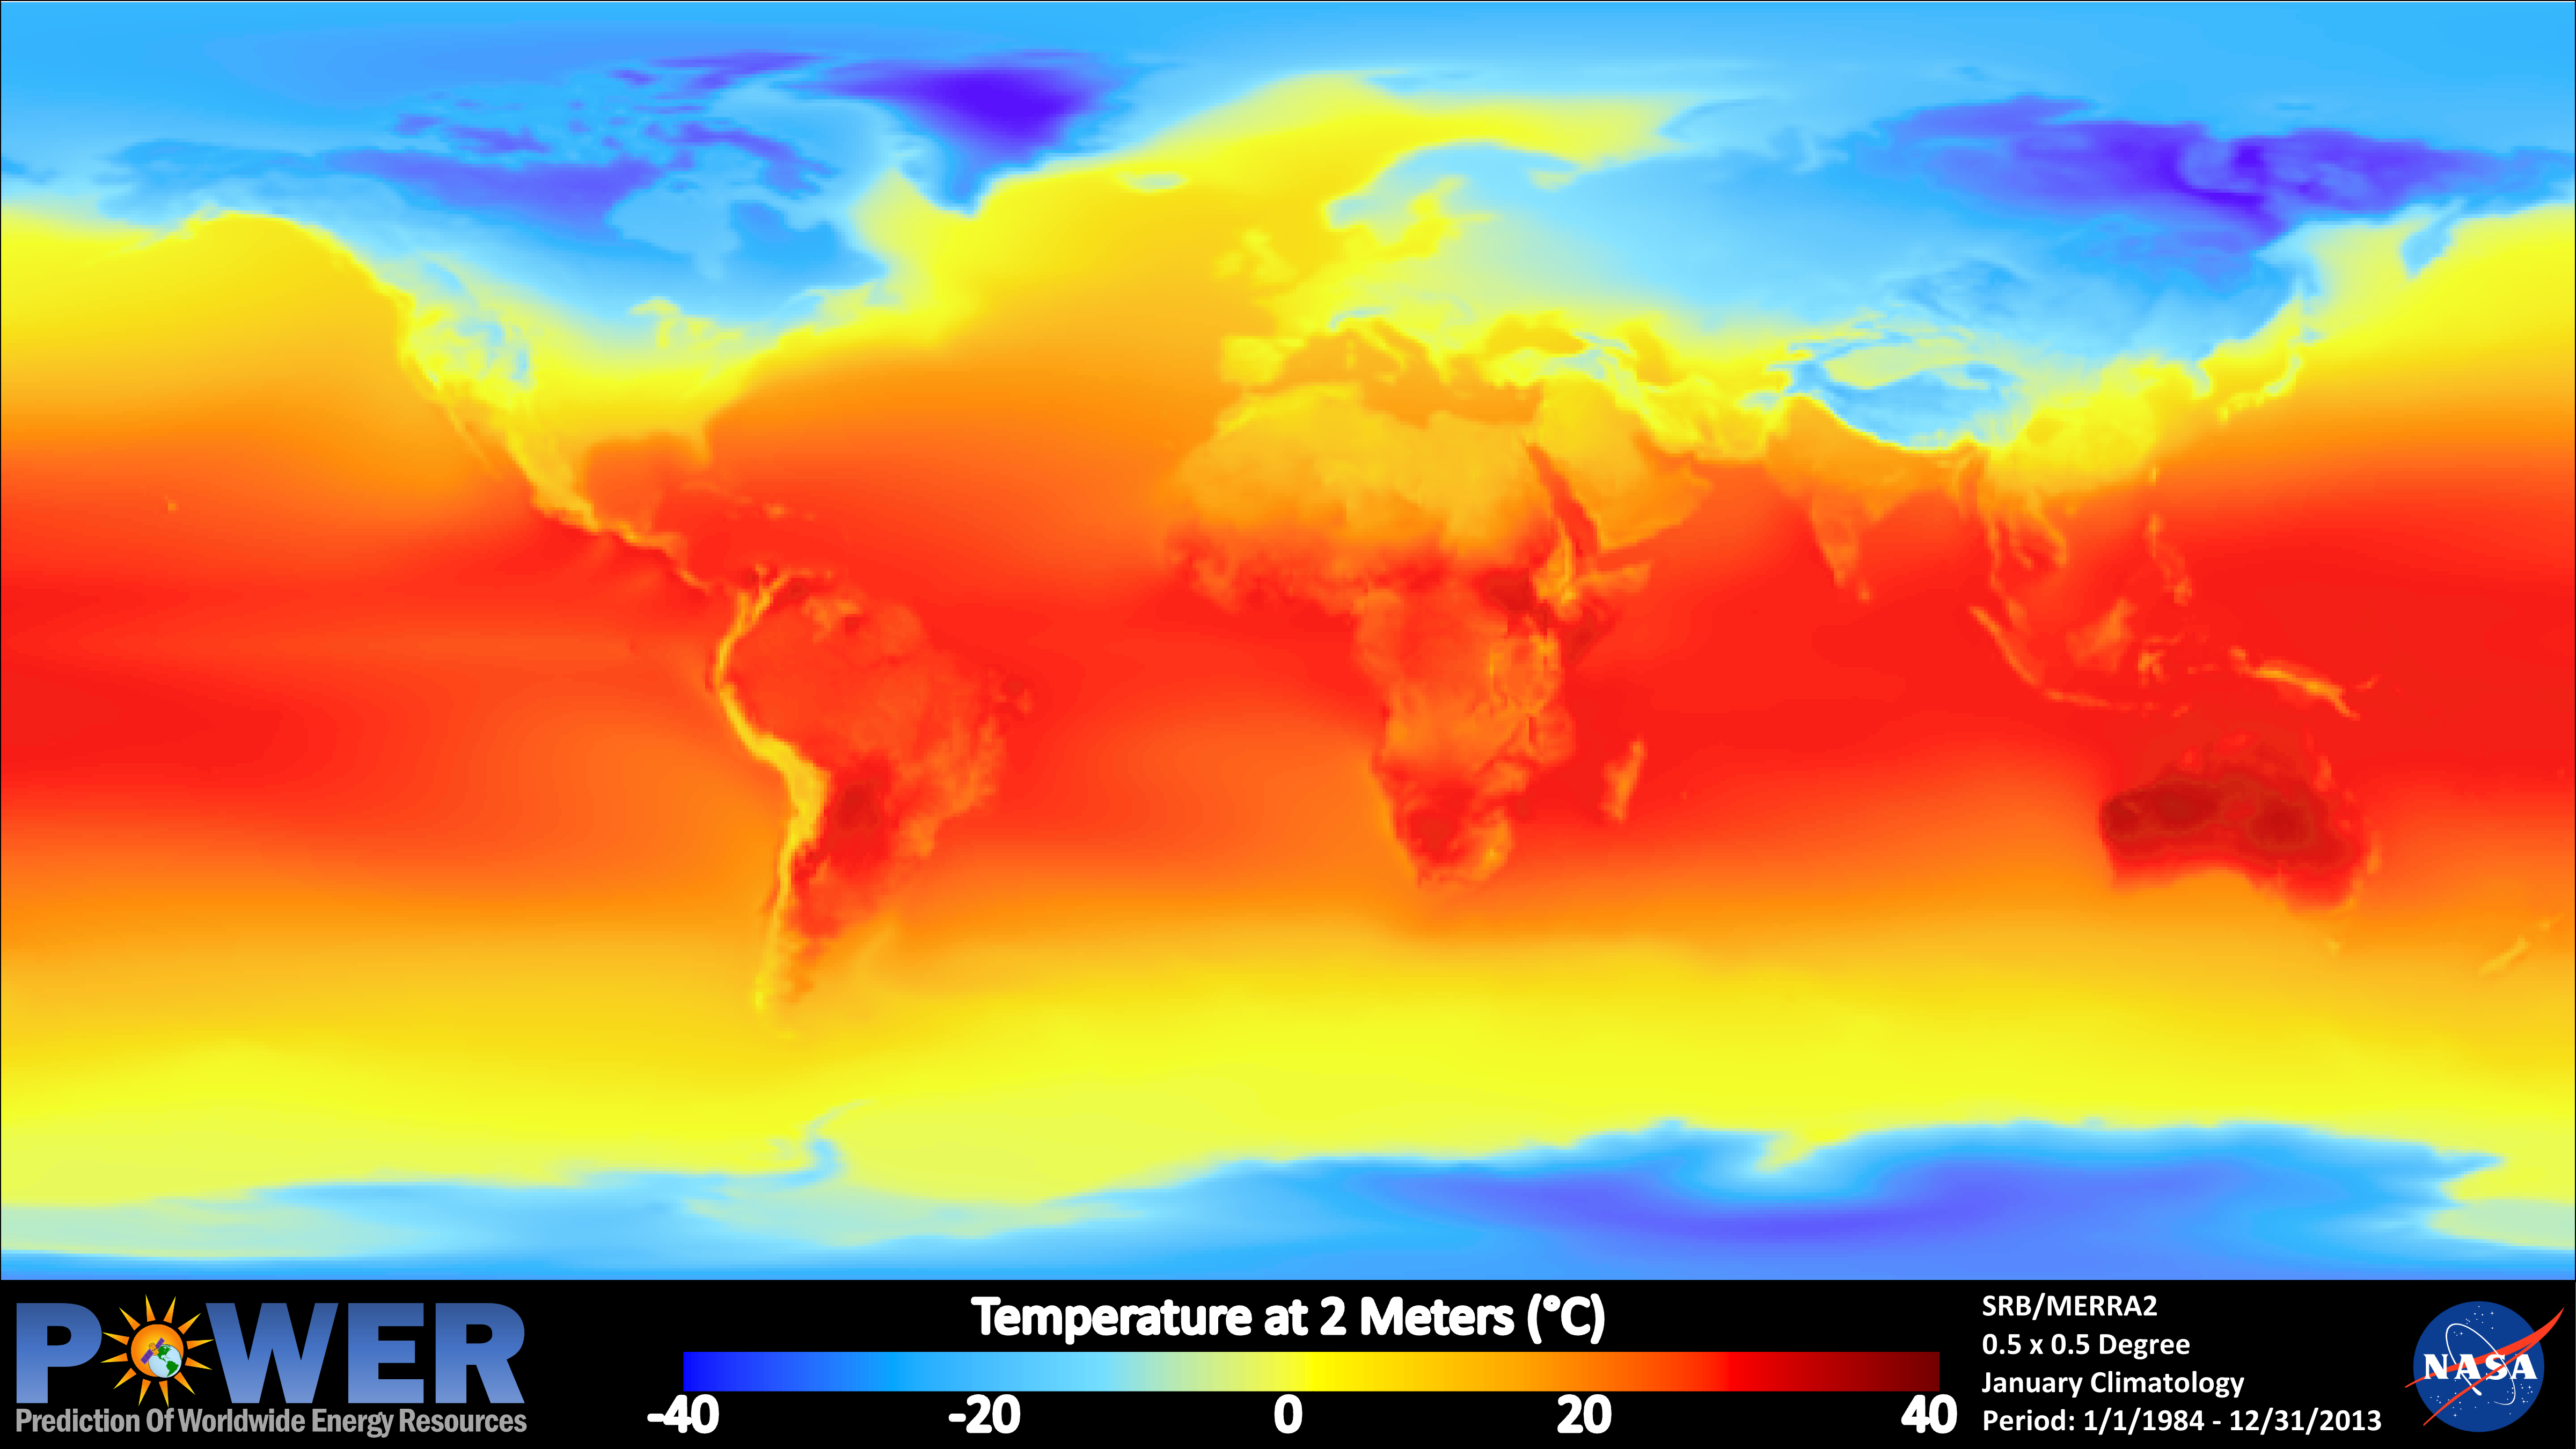
The monthly range of the temperature at 2 meters above the surface of the earth for a given month, averaged for that month over the 30-year period (Jan. 1984 - Dec. 2013).
Branding
| Image | Information |
|---|---|
| POWER Logo: Is used on POWER maps, plots, and other materials. | |
| POWER Icon: Is used as the favorites icon and branding symbol throughout POWER websites. Also, it is included within the POWER Logo. |
Globe